When finance teams and consultants manage more than one Xero organisation, reporting often becomes messy. Each entity has its own chart of accounts, contacts, and tracking categories. Exporting trial balances and manually combining spreadsheets is not only time-consuming but also risky.
Connectorly solves this challenge with grouped Xero organisations, a feature that allows you to pull data from multiple Xero entities into a single model inside Power BI. This makes consolidated reporting accurate, repeatable, and easy to maintain.
What does grouping Xero organisations mean?
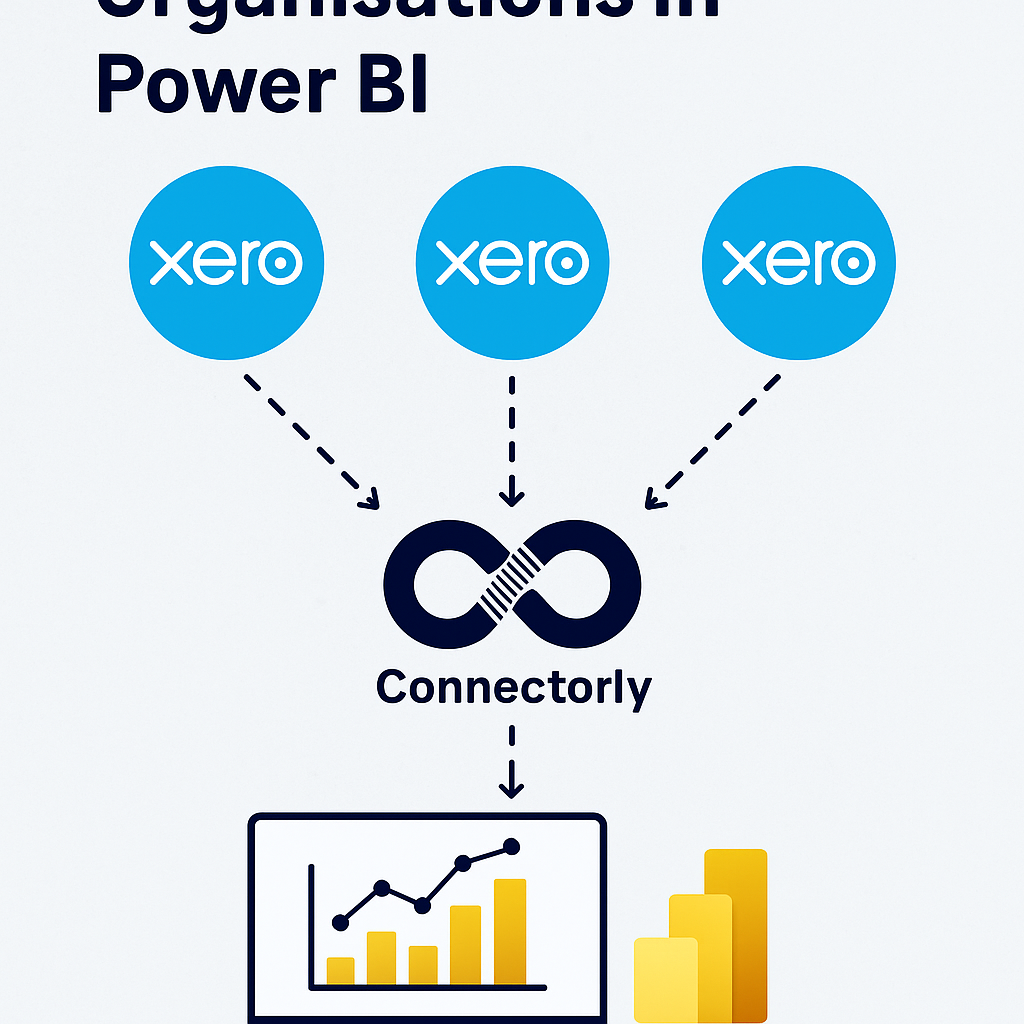
Grouping organisations in Connectorly means treating multiple Xero tenants as a single reporting unit within Power BI.
For example, if your business runs separate Xero organisations for different subsidiaries, you can group them to produce one consolidated profit and loss statement, balance sheet, or cash flow.
Without grouping, you would need to export trial balances separately and manually stitch them together. Connectorly streamlines this process and ensures that every organisation is synced consistently.
How to set up grouped organisations in Connectorly
Setting up groups in Connectorly is straightforward:
- Log in to the Connectorly portal.
- Combine your connectors
- Once complete, all selected organisations feed data into Power BI with consistent identifiers, ready for consolidated reporting.
Building consolidated reports in Power BI
With grouped organisations, Power BI developers and accountants can deliver a variety of consolidated reports without manual overhead.
Profit and loss consolidation
Combine revenue and expenses from all grouped entities into a single consolidated profit and loss. Drill down to individual organisations or roll up to group totals in the same dashboard.
Balance sheet reporting
View group-level assets and liabilities with the option to filter or slice by company. This makes board reporting faster and reduces reconciliation errors.
Cash flow and tracking categories
Analyse cash flow across the group and use tracking categories to compare performance by region, department, or product line—even if each organisation is set up differently.
For ready-to-use dashboards, see our Connectorly templates for Xero and Power BI.
Handling differences in chart of accounts with Connectorly Views
When combining data from different Xero organisations, account codes and names need to be consistent. Otherwise, Power BI may either merge accounts that should be separate or split accounts that should be aggregated. Here are two common scenarios:
Same Account Code, Different Account Names
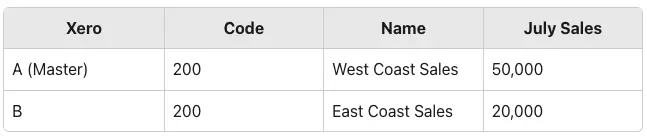
In this setup, both organisations use the same account code 200 but with different account names. When Connectorly combines the data, Power BI will group them under the same code, showing July sales as 70,000 for West Coast Sales and nothing for East Coast Sales.
Fix: Update the account code in Xero B to something unique, such as 201.
After the fix, Power BI correctly reports 50,000 for West Coast Sales and 20,000 for East Coast Sales.
Different Account Code, Same Account Names
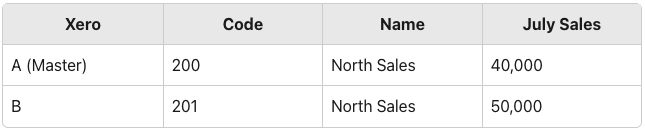
In this case, the account name is consistent (“North Sales”) but the account codes differ. When Connectorly combines the data, Power BI treats them as separate accounts, showing two entries: one for 40,000 and another for 50,000.
Fix: Align the account codes so that both organisations use the same code (for example, 200).
After the fix, Power BI reports 90,000 for North Sales.
Best Practice for Multi-Entity Reporting
To ensure reliable consolidated reporting, it’s best practice to use a consistent chart of accounts across all your Xero organisations. This consistency makes it possible to:
- Directly compare performance across entities (e.g. different types of sales).
- Aggregate financial information cleanly into a single view.
- Reuse the same Microsoft Power BI report across multiple organisations without manual adjustments.
By aligning account codes and names upfront, Connectorly can deliver clear, consolidated insights at scale, helping finance teams and business leaders trust the numbers they see.
Connectorly Views
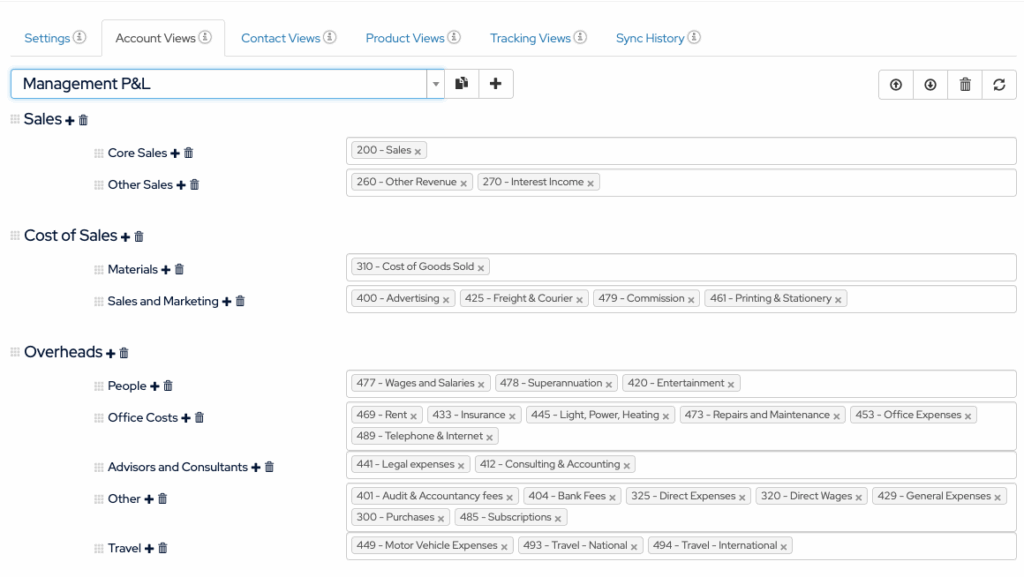
One of the biggest challenges in consolidation is inconsistent account structures. Connectorly addresses this with Connectorly Views.
Views let you group and map accounts, contacts, products, or tracking categories across organisations. For example, “Sales – UK” in one Xero organisation and “Revenue UK” in another can both be grouped as “UK Sales” in Connectorly Views.
This flexibility ensures your consolidated Power BI reports remain accurate even when each organisation is configured differently. Learn more in our guide on Connectorly Views in Power BI.
Combining grouped Xero data with other sources
Most businesses want more than accounting consolidation. With Connectorly, grouped Xero data can be combined with CRM, RMM, or project data inside Power BI.
For example:
- Compare HubSpot deals against consolidated Xero revenue.
- Analyse project profitability across entities using Xero Projects and Power BI.
- Review service delivery costs by integrating with Datto RMM.
See our step-by-step article on how to combine Connectorly data.
Why grouped reporting matters for finance and operations leaders
Grouped Xero reporting saves hours of manual work and improves accuracy.
- For accountants: Faster month-end close and fewer reconciliation errors.
- For COOs and CFOs: Clear insights across entities for better decision-making.
- For Power BI developers: A cleaner data model with less custom maintenance.
Connectorly’s grouped organisations feature provides reliable, structured data that busy teams can trust.
Conclusion: Grouped reporting made simple
Managing multiple Xero organisations no longer needs to mean juggling spreadsheets or building complex models. Connectorly enables you to group organisations in just a few clicks and start delivering consolidated Power BI reports that are accurate, consistent, and actionable.
Whether you’re consolidating for board packs, building financial dashboards, or aligning multi-entity operations, grouped Xero organisations in Connectorly give you a reliable foundation for reporting.
FAQs about Grouped Xero Organisations in Power BI
What does “grouping Xero organisations” do in Connectorly?
It lets you treat multiple Xero tenants as one reporting unit in Power BI. Connectorly pulls each organisation’s data into a consistent model so you can build consolidated reports while keeping drill-down to the entity level.
How do I set up grouped organisations in Connectorly?
Log in to the Connectorly portal, then combine your connectors.
Once the grouping is done, connect to the main connector’s database.
Can I build consolidated P&L, balance sheet, and cash flow?
Yes. Once grouped, you can produce consolidated profit and loss, balance sheet, and cash-flow reports, and still filter or drill to each organisation.
What if charts of accounts differ across entities?
Use Connectorly Views to map and group accounts, contacts, products, and tracking categories (e.g., “Sales – UK” and “Revenue UK” can be grouped as “UK Sales”). This keeps consolidated results accurate even with different setups.
Can I combine grouped Xero data with other sources?
Yes. You can join grouped Xero data with HubSpot, Datto RMM, or other sources in Power BI. See our guide on combining Connectorly data for step-by-step instructions.