Power BI desktop tips to speed up your everyday tasks.
Power BI Desktop is a powerful tool for visualising your data, but learning how to streamline common tasks can save you significant time. This guide provides clear, step-by-step instructions to help you work smarter—not harder—in Power BI. Whether you’re a CTO, COO, accountant, or any professional aiming to enhance your reporting skills, these practical tips will improve your efficiency and productivity.
How Can I Select Multiple Items Quickly in Power BI?
A quick and effective method to manage multiple items within Power BI is using the Ctrl + Click shortcut. Suppose you need to change the formatting on several visuals simultaneously or select multiple fields quickly. Here’s how:
Simply hold down the Ctrl key while clicking on multiple items in the Fields or Visualisations pane. This straightforward technique allows you to edit or delete multiple visuals at once or easily select several columns when designing your table.
By integrating these shortcuts into your workflow, you’ll quickly appreciate the improvement in speed and ease of managing your visuals.
Why Should I Use ‘Transform Data’ Before Creating Visuals?
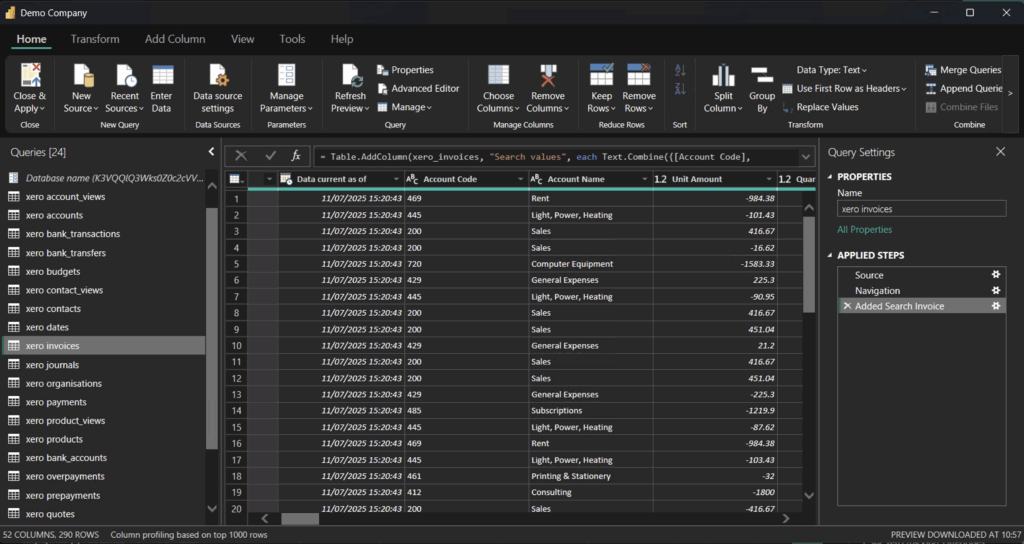
Using the “Transform Data” button to open the Power Query Editor should become a standard part of your workflow. Cleaning data before visualisation ensures your reports are accurate, tidy, and optimised for better performance. To start:
Click “Transform Data” to enter Power Query Editor. Here, you can rename columns to simplify measure creation later, remove unnecessary columns that clutter your report, change data types (such as converting text fields into dates), or even fill and replace missing values to avoid inaccuracies in your analysis.
Regular use of Power Query ensures your data is consistently reliable and easy to use, significantly reducing the time spent troubleshooting later on.
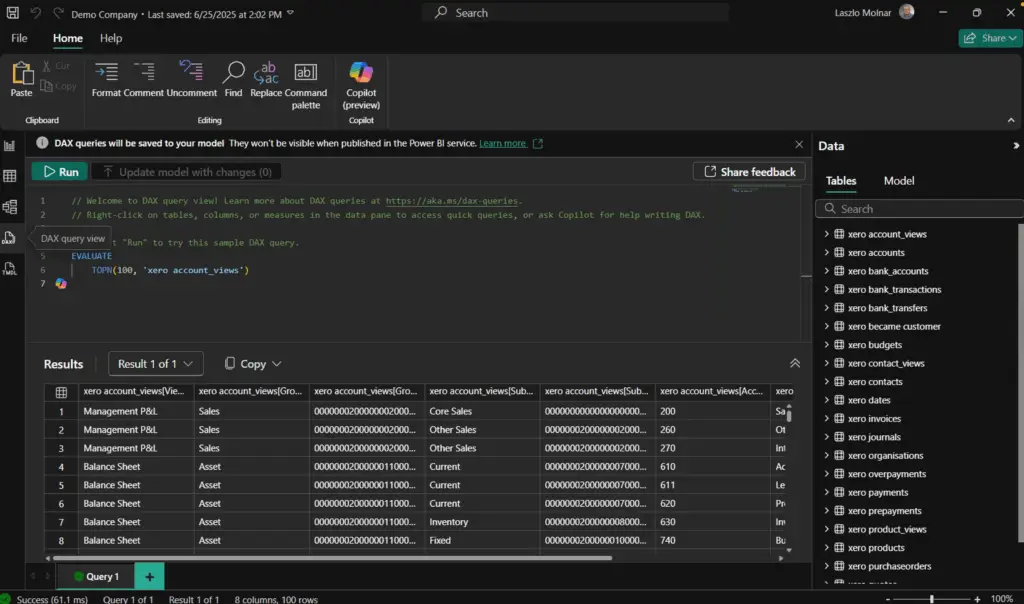
Should I Use Measures or Calculated Columns in DAX?
In Power BI, creating DAX calculations often leads beginners to a crossroads: Should you use measures or calculated columns? The clear choice, when possible, is to opt for measures.
Measures calculate results dynamically, meaning they are computed as you interact with your visuals. This dynamic nature saves memory and enhances performance, compared to calculated columns, which store static data directly in your model. Measures provide greater flexibility, enabling dynamic and interactive reporting without unnecessary resource consumption.
For enhanced report efficiency and cleaner data models, consistently prioritise measures over calculated columns in your DAX expressions.
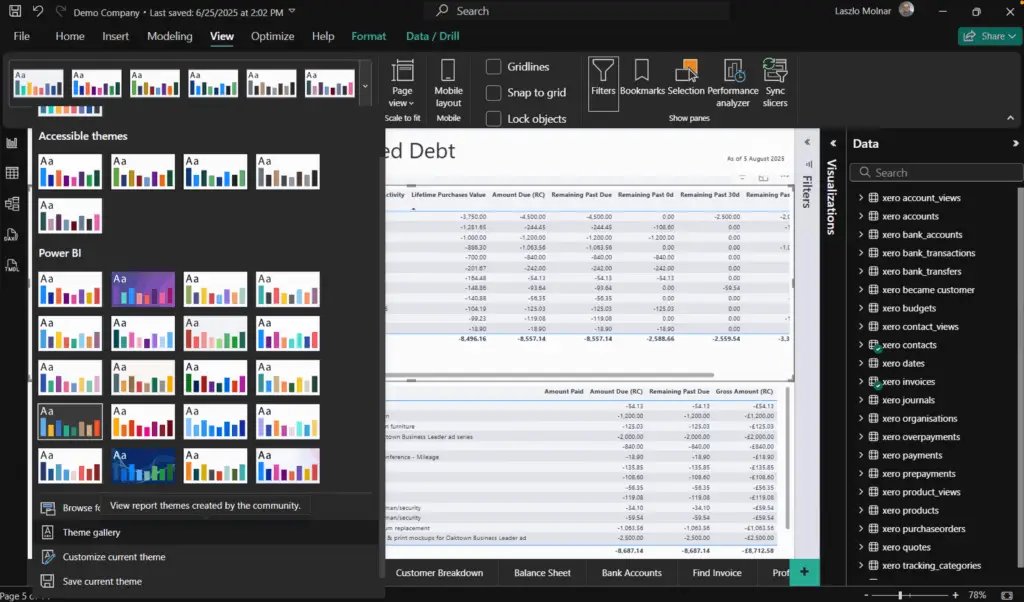
How Can I Keep Branding Consistent Using Power BI Themes?
Maintaining consistent branding across your reports is straightforward with Power BI Themes. Using themes ensures your visuals share the same colour palette, fonts, and styles, saving considerable design time.
To use themes effectively:
Go to the “View” menu, select “Themes,” and either choose from one of the preset themes or import a custom JSON theme file by clicking “Browse for themes…”. This approach standardises your report aesthetics, creating professional and visually coherent dashboards effortlessly.
This consistency is especially valuable when integrating data from platforms like Xero or HubSpot, ensuring all data visualisations align with your corporate identity.
At Connectorly, we’ve found the Power BI Theme Generator to be incredibly helpful.
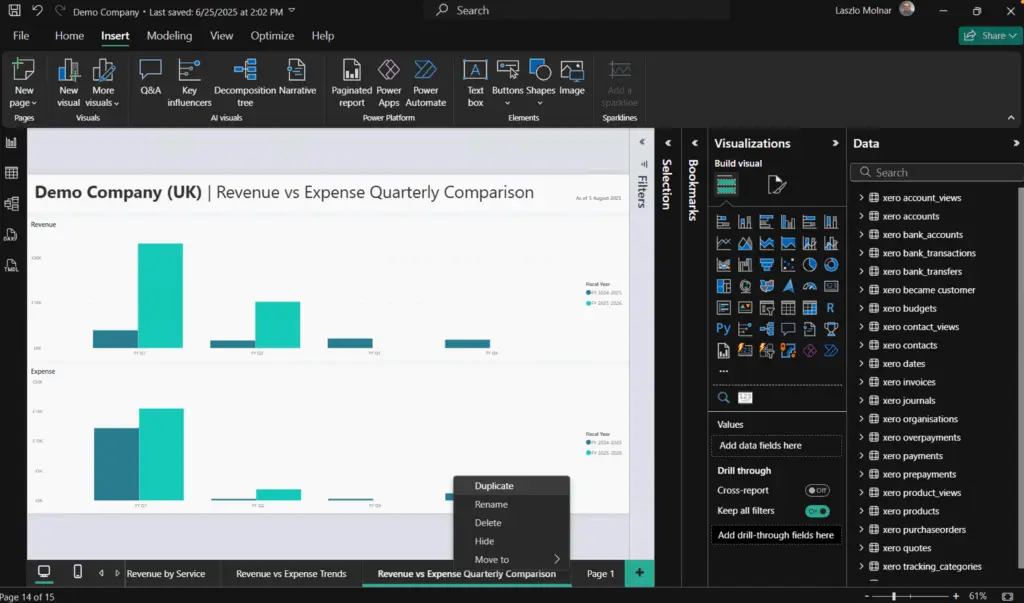
How Do I Quickly Duplicate Visuals and reports in Power BI Desktop?
Duplicating visuals can significantly speed up your workflow, particularly when creating reports with similar visualisation structures. Rather than manually recreating visuals, simply duplicate them to save time.
To duplicate visuals quickly:
Click on the visual you want to duplicate to select it, then press Ctrl + C to copy and Ctrl + V to paste. Alternatively, you can use the right-click context menu and select “Copy” followed by “Paste.” You can then easily modify the duplicated visual to show different data without having to start from scratch.
This simple tip will help you rapidly build out detailed and cohesive reports, boosting your productivity.
Wrapping It Up
Using these essential Power BI desktop tricks, beginners and busy professionals can quickly elevate their reporting capabilities. By integrating these methods into your daily tasks, you’ll spend less time managing data and more time analysing and leveraging insights.
For more practical Power BI and integration tips, visit our Connectorly Help Centre.