Creating and Utilizing Views in Power BI Desktop with Connectorly for Xero & Power BI
Once you manage to get your Xero data into Microsoft Power BI with Connectorly, you can explore the freedom of reporting. One of the greatest features Connectorly gives you is using different views. Let’s learn how to create them and why they are so great!
With Connectorly for Xero and Power BI, generating your balance sheet, P&L report, or any financial reports from Xero data becomes effortless. Most of your report will organize similar records and present values based on these groupings.
In Xero, typical groupings involve Chart of Accounts, Products, Contacts, or Tracking codes.
Connectorly allows you to manage these groupings easily. Moreover, if you’re not satisfied with the predefined groups, you can create your custom groupings for Chart of Accounts, Products, and Contacts. These custom groupings we call ‘views.’
Views are one component of a well-structured reporting model. Our complete guide to Xero reporting in Power BI explains how groupings, tracking categories, financial data and relationships work together to support reliable dashboards and reports.
Managing Views with Connectorly for Xero & Power BI
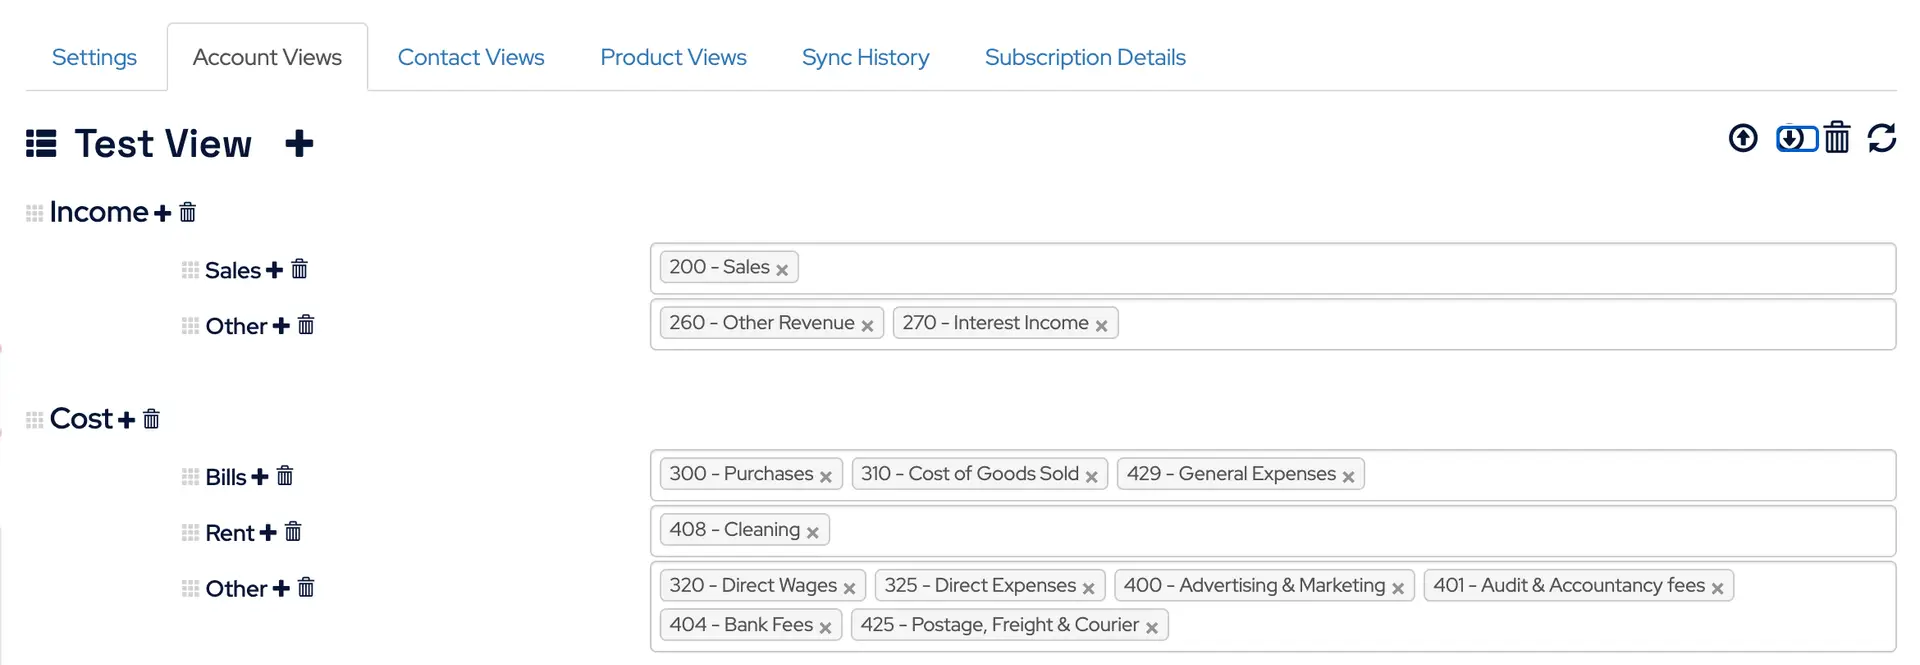
You can manage your views on the Connectorly for Xero & Power BI page. Upon logging in to the Connectorly portal and opening your connector, you’ll find three tabs to manage your views:
Account Views: Utilize Xero’s Chart of Accounts for grouping.
Contact Views: Employ Xero contacts for grouping.
Product Views: Utilize Xero products/services for grouping.
You can create multiple views on each tab. To manage the view, you need at least a Business Administrator role.
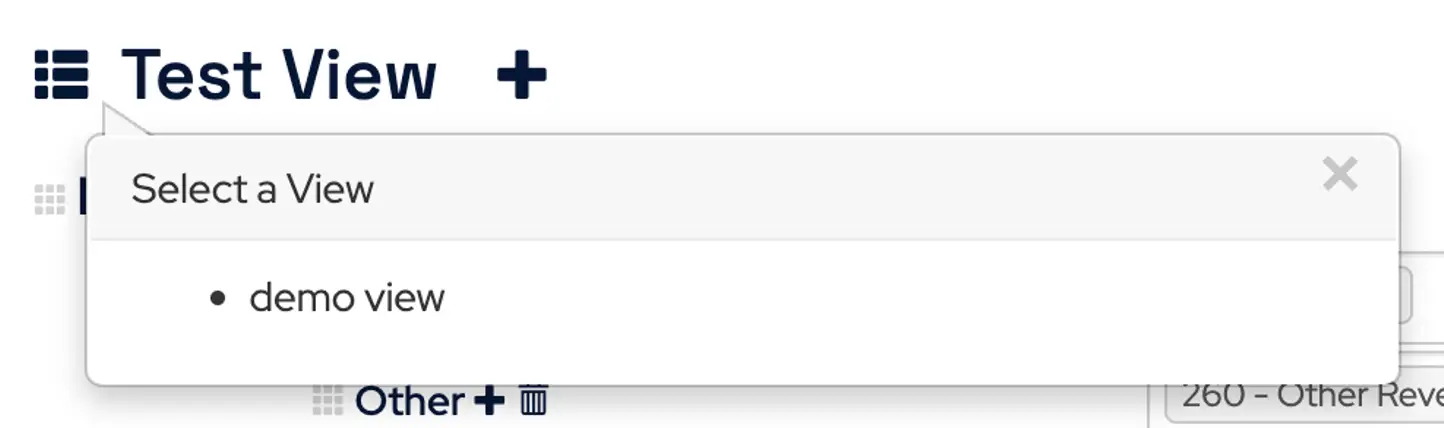
You can create a new view, a new group and a new subgroup using the “+” sign. The Bin sign allows deleting existing views, groups, or subgroups. With the view selector, you can easily switch between views.
At the view level, options include replacing the view with imported values, exporting the view into a file, deleting the view, and refreshing the data from Xero.
If you wish to rename a view, group, or subgroup, click on the name and overwrite it. These functionalities are available for both Contact views and Product views.
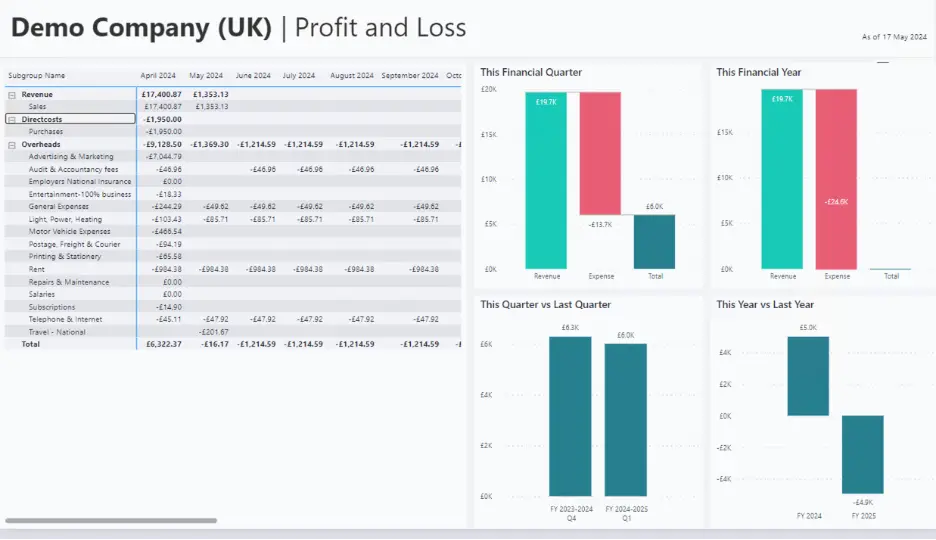
For instance, the Profit & Loss template. Once the template is open and you’ve connected to your database, you’ll notice under the Data section, xero account_views, xero contact_views, and xero product_views tables are available.
In our P&L template, we’re already filtering on the xero account_views table, with the Profit and Loss view selected.
You’ll observe that the views created from the Connectorly Portal are readily available in Power BI, enabling you to adjust your P&L report accordingly.
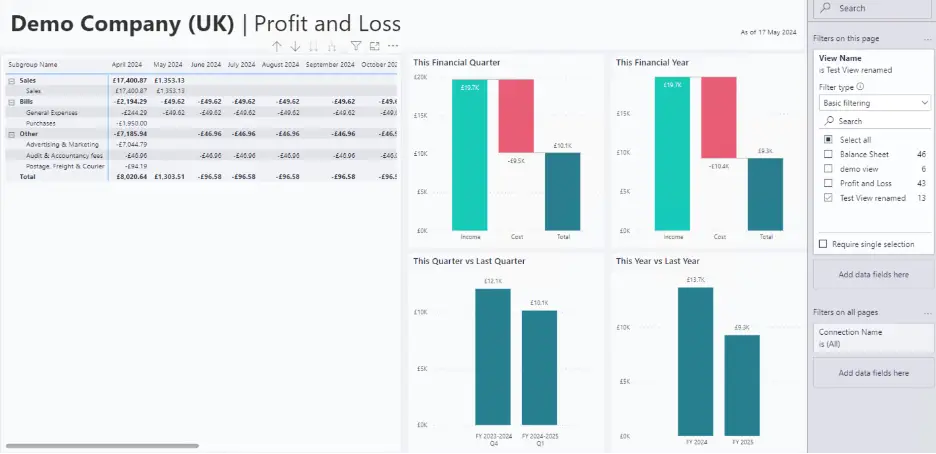
Now if you switch to your custom view, the data in the report will be accordingly changed by Power BI.
Conclusion
This process demonstrates how easily you can create different views and apply them to your reports. With this functionality, you can enhance your reporting experience and seamlessly switch between different views based on your requirements.
Using Connectorly for Xero & Power BI not only gives you flexibility with the custom views but also
Works across multiple Xero Organisations so that you can aggregate data across organisations or filter across Organisations in the same report
Allows you to rebase different Xero Organisations to a common reporting currency.
Makes it easy to work across different date ranges such as fiscal years, halves, quarters, months and weeks
Supports 4-4-5 week months as well as the more usual calendar ranges.