Many organisations using Xero eventually need more advanced reporting than the standard accounting reports provide. Finance teams often want visual dashboards, deeper financial analysis, or the ability to combine accounting data with operational metrics.
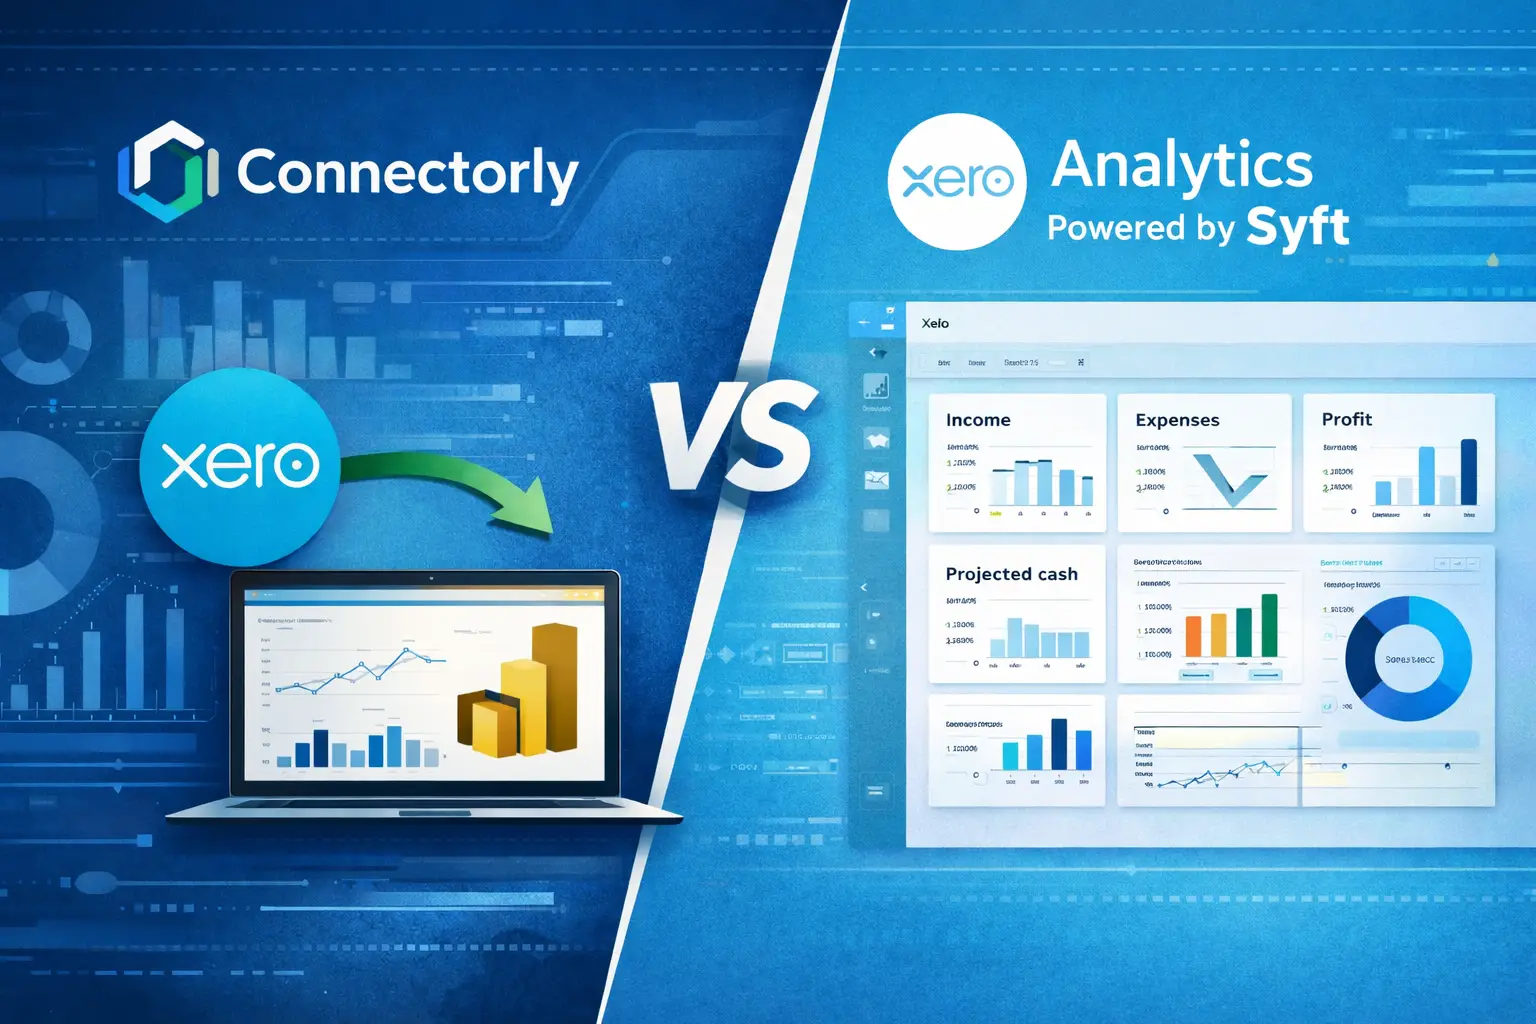
Two approaches commonly considered are Xero’s built-in analytics (powered by Syft) and Connectorly for Xero & Power BI.
While both options work with Xero data, they serve different reporting needs. One focuses on financial reporting inside the accounting platform, while the other enables broader analytics in business intelligence tools.
In this article, we explain the key differences between Connectorly and Xero Analytics powered by Syft.
What Is Xero Analytics Powered by Syft?
In September 2024, Xero announced the acquisition of Syft Analytics, a cloud-based reporting and analytics platform used by accountants and small businesses for financial insights.
Following the acquisition, Xero began introducing “Analytics powered by Syft” inside the Xero platform. The goal is to expand Xero’s reporting and analytics capabilities with visual dashboards, insights, and forecasting tools.
These analytics features allow users to view financial performance through graphs, visual dashboards, and interactive reports. They can analyse metrics such as income, expenses, profitability trends, and projected cash flow.
The analytics tools are accessed through the Reports area inside Xero, where users can explore their financial data through visual dashboards and export reports when needed.
Access to certain analytics features may depend on the Xero subscription plan and regional availability, as the rollout is still expanding across markets.

Why Businesses Look Beyond Standard Xero Reports
Xero includes many useful accounting reports, including Profit and Loss, Balance Sheet, and Cash Flow statements.
However, organisations often need additional capabilities when analysing their financial data. For example, they may want to combine accounting data with CRM systems, marketing tools, or operational data sources.
Leadership teams also frequently require dashboards that track financial performance alongside sales pipelines, customer acquisition metrics, or operational KPIs.
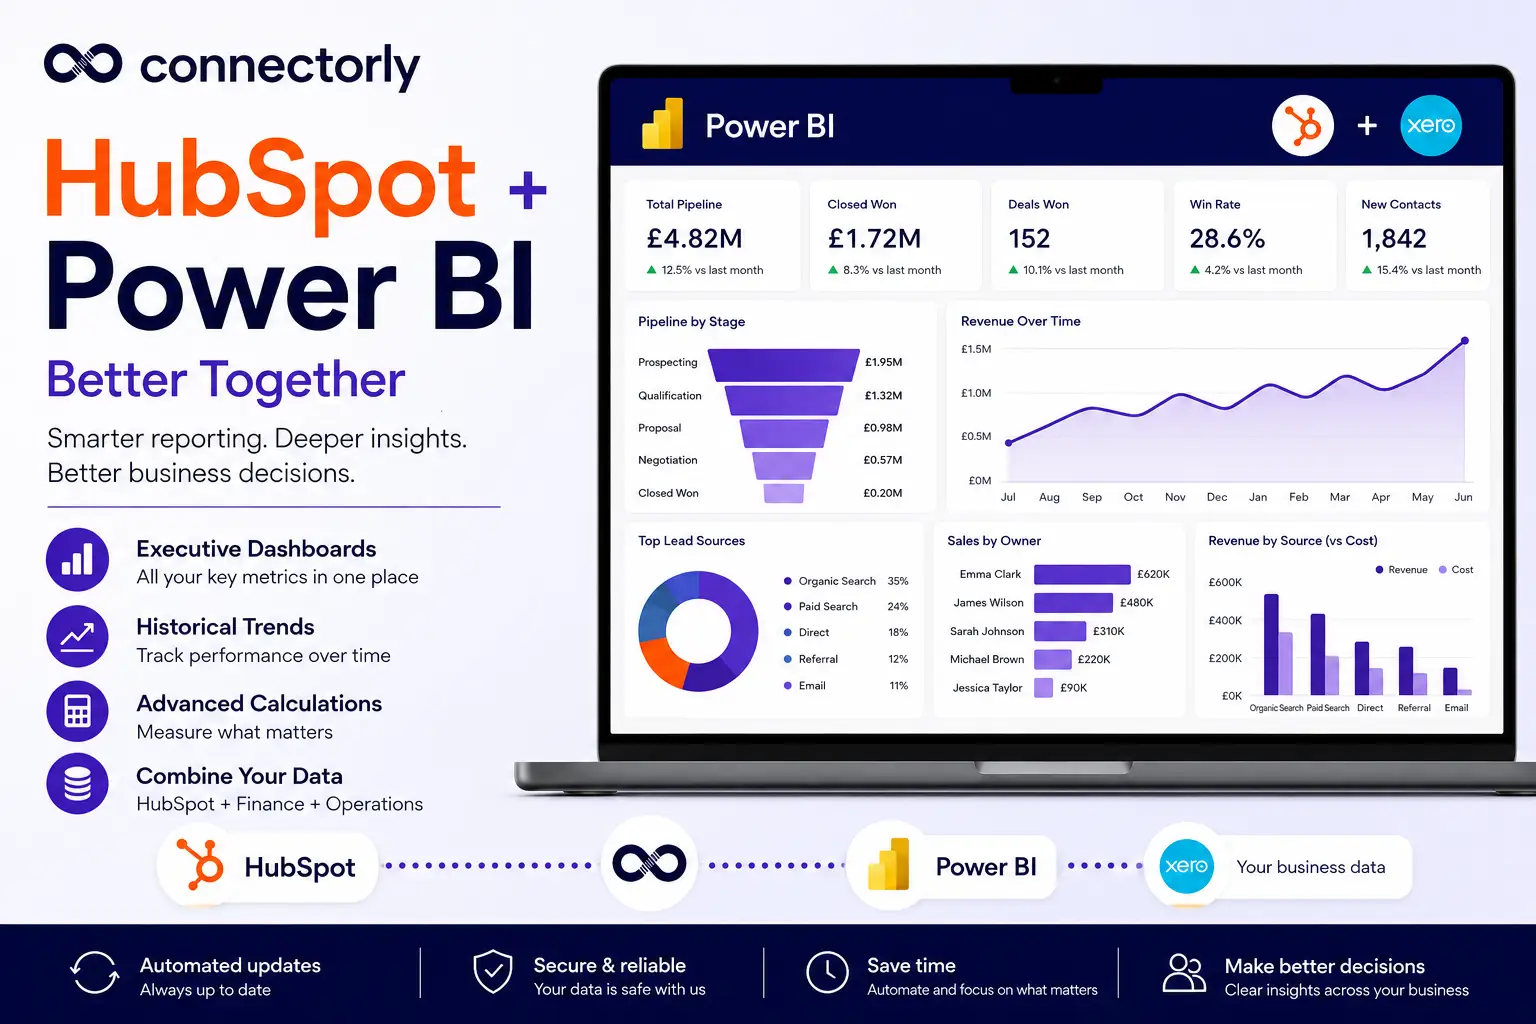
These broader reporting scenarios are typically handled by business intelligence platforms such as Power BI, which are designed to analyse data across multiple systems.
What Is Connectorly and How Does It Work with Xero?
Connectorly is a data integration platform designed for analytics and reporting tools, including Power BI.
Instead of generating reports inside its own interface, Connectorly retrieves data from Xero and prepares it for analysis within Power BI.
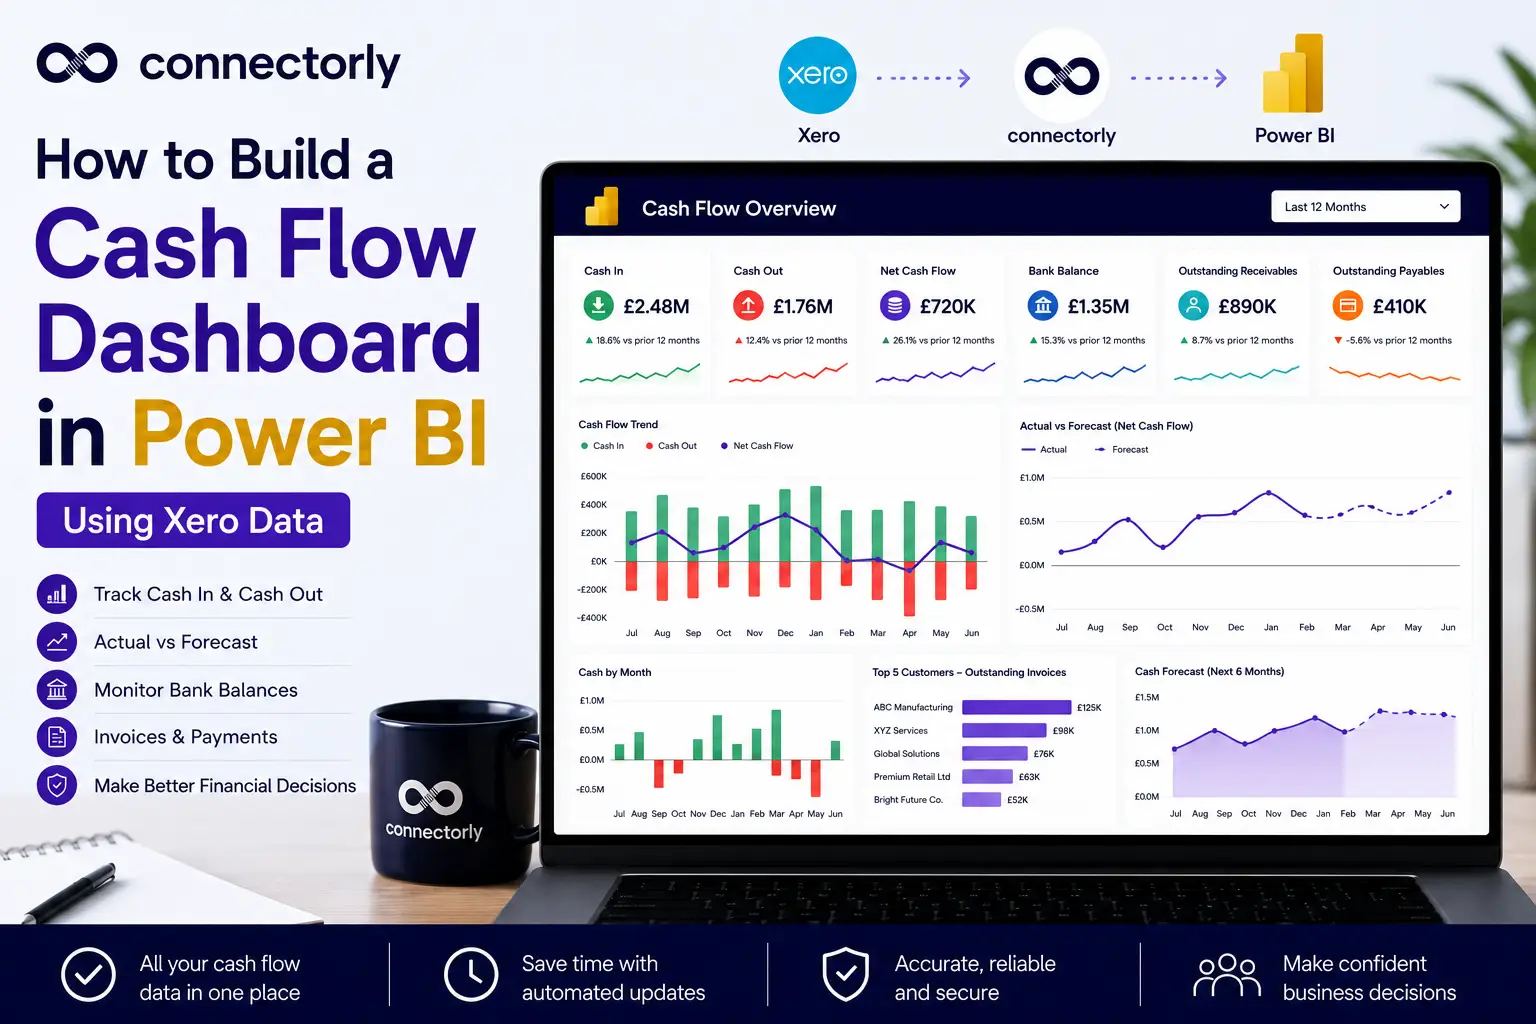
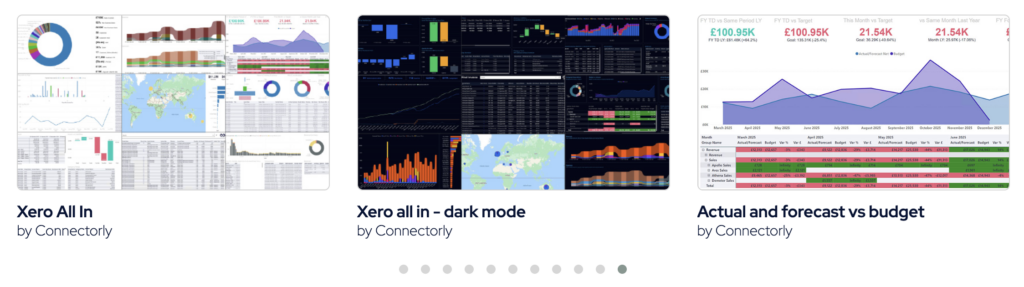
When Connectorly connects to Xero, it extracts data from multiple endpoints such as invoices, bills, contacts, accounts, journals, and tracking categories. This information is organised into the Connectorly Xero Data Model, which is structured for reporting and analysis.
Power BI developers can then build dashboards and reports using this structured dataset.
If you want to see how the connection works in practice, this guide explains the setup process:
How To Connect Xero to Power BI Desktop and Start Reporting in Minutes
How Is the Reporting Approach Different?
The biggest difference between the two solutions is where reporting happens.
Xero Analytics powered by Syft focuses on financial dashboards inside the Xero platform. Users explore and visualise their accounting data directly within the Xero interface.
Connectorly takes a different approach. It focuses on making Xero data available to external analytics tools, especially Power BI.
This distinction becomes important when organisations need reporting that combines financial data with other business systems.
For example, a company might want to analyse:
- Revenue performance alongside CRM sales data
- Customer profitability linked to marketing campaigns
- Financial performance combined with operational metrics
Business intelligence platforms such as Power BI are commonly used for these types of cross-system analytics.
Can Xero Analytics Replace Business Intelligence Tools?
Xero Analytics powered by Syft provides valuable financial insights within the accounting platform. It allows users to visualise financial performance, monitor key metrics, and explore financial trends.
However, it is primarily designed for financial reporting inside Xero.
Business intelligence tools such as Power BI serve a broader purpose. They allow organisations to combine multiple data sources, build custom data models, and create dashboards that span different departments.
For companies that rely on Power BI for organisation-wide reporting, structured access to accounting data becomes important.
Connectorly helps provide that structured dataset for Xero.
How Connectorly Supports Advanced Xero Analytics
Connectorly is designed for teams building flexible reporting environments with Power BI.
Because the Connectorly Xero Data Model includes related entities such as invoices, accounts, contacts, and journal entries, analysts can build financial dashboards without needing to restructure raw API data.
This makes it easier to create reports such as:
- Profitability dashboards
- Accounts receivable analysis
- Budget vs actual comparisons
- Consolidated reporting across multiple Xero organisations
Power BI also allows these financial insights to be combined with other business data sources.
Which Option Is Better for Xero Reporting?
Both solutions improve reporting capabilities for Xero users, but they serve different needs.
Xero Analytics powered by Syft enhances the reporting tools available inside Xero, helping finance teams visualise and analyse financial performance more easily.
Connectorly focuses on data integration for analytics platforms such as Power BI, allowing organisations to build dashboards that combine Xero data with other business systems.
For teams that already rely on Power BI for business intelligence, having structured access to accounting data can make it easier to build comprehensive financial dashboards.
Understanding how these approaches differ helps organisations choose the reporting workflow that fits their technology stack and reporting requirements.