What Is an Aged Receivables Dashboard?
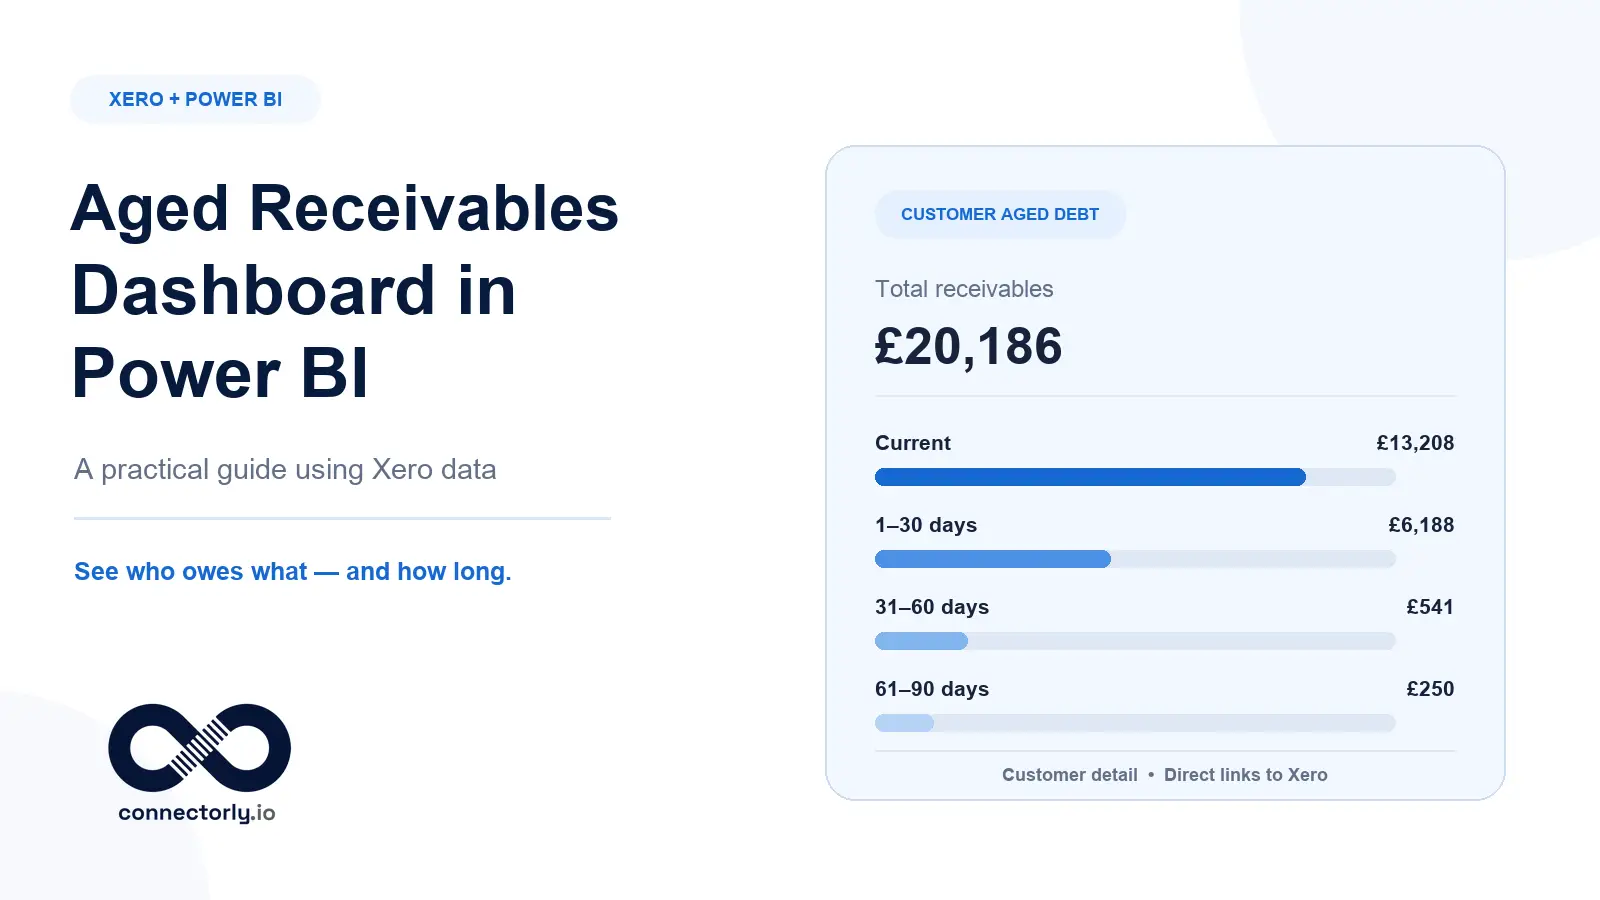
An aged receivables dashboard shows which customers owe money, how much remains outstanding and how long each balance has been overdue. It turns a list of unpaid invoices into a practical view that finance teams can use to prioritise collection work and identify growing credit risk.
Most dashboards divide outstanding balances into ageing buckets such as Current, 1–30 days, 31–60 days, 61–90 days and more than 90 days overdue. They may also show the total amount outstanding, the overdue proportion, the number of unpaid invoices and the customers responsible for the largest balances.
Xero already provides an Aged Receivables Summary report, which shows what customers owe and how long their balances have been outstanding. The report can age transactions by invoice date or due date and can include approved outstanding invoices, credit notes and overpayments as at the selected report date.
Power BI becomes useful when an organisation wants a more interactive view, needs custom collection KPIs, wants to compare several Xero organisations or needs to combine receivables with other business information. Users can filter by customer, organisation, account manager or reporting period and then drill from a summary KPI into the invoices behind it.
In this guide, we will build that reporting approach using Xero data supplied through Connectorly. We will explain the accounting logic first, identify the required data, create the ageing calculations and design a dashboard that remains reconcilable to Xero. For broader background on the reporting architecture, see our complete guide to Xero reporting in Power BI.
What Should an Aged Receivables Dashboard Show?
A useful dashboard should answer three questions immediately: how much customers owe, how much is overdue and which balances require attention first.
The core KPIs normally include:
Total receivables: the combined outstanding balance of all included customer transactions.
Overdue receivables: the amount with a due date earlier than the selected reporting date.
Overdue percentage: overdue receivables divided by total receivables.
Ageing-bucket balances: amounts classified as Current, 1–30, 31–60, 61–90 and 90+ days overdue.
Overdue invoice count: the number of individual invoices requiring payment.
Customers with overdue balances: the number of customers responsible for those invoices.
Oldest overdue invoice: the invoice that has remained unpaid for the longest period.
Largest overdue customers: customers representing the greatest collection exposure.
The dashboard should also provide invoice-level detail, including the customer, invoice number, invoice date, due date, original invoice total, amount paid, remaining balance, currency and ageing bucket.
The remaining balance is particularly important. An invoice originally raised for £10,000 may have only £2,000 left to collect after a partial payment or credit note. Using the original invoice total would overstate receivables and could lead the finance team to chase an amount that is no longer due.
Every visual should use the same reporting date and ageing method. This keeps the summary cards, charts and invoice table consistent and makes reconciliation with Xero much easier. Receivables also form an important part of cash-flow reporting in Power BI, because overdue customer balances affect when expected cash becomes available.
The Connectorly Data Behind the Dashboard
The dashboard can be built primarily from the Xero invoices and Xero contacts tables supplied by Connectorly. These tables are already related in the Connectorly Power BI templates, allowing invoice balances to be analysed by customer and organisation.
The most relevant invoice fields include:
Connection Name: identifies the Xero organisation.
Contact Name and Contact ID: identify the customer.
Invoice Number: identifies the individual sales invoice.
Invoice Date and Due Date: support invoice and overdue analysis.
Invoice Type: distinguishes sales invoices, bills and their respective credit notes.
Status: distinguishes authorised, paid, draft, submitted and forecast invoices.
Gross Amount: records the total invoice value.
Amount Paid: records the amount already settled.
Amount Credited: records credit applied to the invoice.
Amount Due: records the balance that remains outstanding.
Remaining Past 0D, 30D, 60D and 90D: provide ready-made overdue values.
Internal URL: links users directly from Power BI to the corresponding transaction in Xero.
Data current as of: shows when the record was obtained from Xero.
Connectorly returns one record for each invoice line so users can analyse receivables by account, product, description or tracking category. However, invoice-level values such as Amount Due, Amount Paid and Amount Credited are allocated proportionately across those lines. This means the values can be summed without multiplying the invoice total.
For multi-organisation or multicurrency reporting, use the corresponding reporting currency fields, such as Amount Due (RC), so values from different currencies are not added together incorrectly.
You can review every available field in the official Connectorly Xero invoices data dictionary.
Start with the Connectorly Aged Debtors and Creditors Template
The fastest way to create the dashboard is to use Connectorly’s free Aged Debtors and Creditors Power BI template. It already uses the Connectorly Xero data model and includes the required table relationships, calculations and report structure.
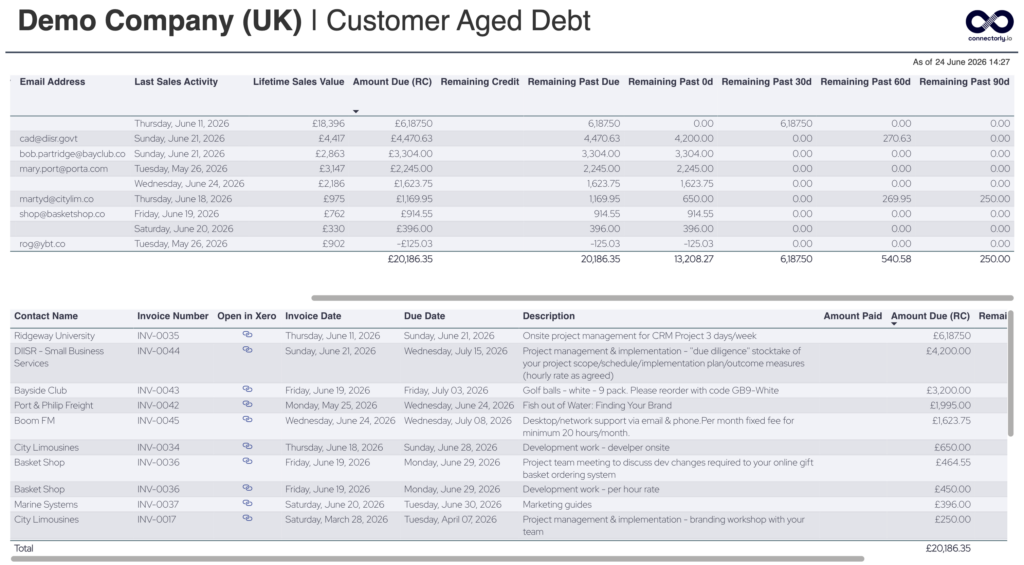
The template contains dedicated debtor and creditor reports. For receivables analysis, the debtor pages show outstanding amounts at due, 30-day, 60-day and 90-day intervals. Users can select a customer or ageing category to see the invoices behind the balance and can follow the invoice link directly into Xero.
The template also includes broader customer measures such as lifetime sales, last sales activity and average days to pay. A separate report compares customer payment behaviour between financial years, helping finance teams identify customers whose payment performance is improving or deteriorating.
To use it:
Download the template in the required currency format.
Open the
.pbitfile in Power BI Desktop.Enter the Connectorly server, database, username and password from your Connectorly settings.
Allow Power BI to load the Xero data model.
Confirm that the Connection Name filter includes the intended Xero organisation or group.
Refresh the report and compare the totals with Xero before making design changes.
The existing template is a practical starting point rather than a fixed final report. Every visual, measure, colour and page can be customised in Power BI Desktop. The following sections explain the underlying ageing logic and the steps required to adapt the dashboard to your organisation.
Understand the Ageing Logic Before Customising the Dashboard
Ageing calculations depend on two decisions: the reporting date and the date used to measure the age of each transaction.
For collection reporting, invoices are normally aged by due date. An invoice that is not yet due belongs in the current bucket, even if it was issued several weeks earlier. Once the due date passes, its remaining balance moves through the overdue buckets as time progresses.
Xero can also age receivables by invoice date. This answers a different question: how long the invoice has existed rather than how late the customer is paying. Both approaches are valid, but the Power BI dashboard and the Xero report must use the same method before their totals and buckets can be compared.
The usual due-date structure is:
Current: not yet due.
1–30 days overdue: due date passed by no more than 30 days.
31–60 days overdue: between 31 and 60 days late.
61–90 days overdue: between 61 and 90 days late.
90+ days overdue: more than 90 days late.
Connectorly provides ready-made remaining-balance and overdue fields, so the supplied template does not require users to recreate the core ageing logic from raw invoice records. This reduces the risk of ignoring partial payments, credited amounts or the remaining balance.
However, always confirm the bucket labels and reporting date displayed in the report. If your organisation uses different collection intervals—such as 7, 14, 30 and 60 days—you can create custom groups in Power BI while retaining the Connectorly values for reconciliation.
The goal is not simply to reproduce Xero visually. It is to preserve Xero’s accounting result while presenting the balances in a format that supports collection decisions.
How to Build the Dashboard in Power BI
1. Duplicate the Template Page and Set the Reporting Scope
Begin by duplicating the existing Customer Aged Debt page in the Connectorly template. Keeping the original page unchanged gives you a working reference and makes it easier to identify whether a later customisation has altered the totals.
Next, define the scope of the report:
Select the required Xero organisation using Connection Name.
Confirm the reporting currency.
Check the Data current as of timestamp.
Retain the existing filters that distinguish customer receivables from supplier payables.
Exclude draft, submitted and forecast invoices unless the dashboard is intentionally designed to include potential future receivables.
If several Xero organisations are connected, begin with one organisation. A single-entity comparison is easier to reconcile with Xero and provides a reliable baseline before the report is expanded into a combined view.
Also decide whether users need to change the organisation themselves. A visible Connection Name slicer is useful for finance teams working across several entities. For an organisation-specific report, a fixed page-level filter may create a cleaner experience.
Finally, give the page a clear dynamic title such as Customer Aged Debt – Demo Company (UK) and display the data timestamp prominently. Users should always know which organisation they are viewing and how current the information is before using the dashboard for collection decisions.
2. Build the Customer Ageing Summary
Use a Power BI matrix to create the customer-level summary shown in the Connectorly template.
Add the following customer fields as rows:
Contact Name
Email Address
Last Sales Activity
Then add these values:
Lifetime Sales Value
Amount Due (RC)
Remaining Credit
Remaining Past Due
Remaining Past 0D
Remaining Past 30D
Remaining Past 60D
Remaining Past 90D
Sort the matrix by Amount Due or Remaining Past Due in descending order. This places the customers with the largest collection exposure at the top of the report.
Keep the total row visible so users can reconcile the combined outstanding balance. Apply consistent currency formatting and avoid mixing transaction-currency values with reporting-currency values in the same total. When the report combines organisations or currencies, use the reporting-currency versions available in the model.
Conditional formatting can make the ageing pattern easier to interpret. Use a light neutral colour for current balances, then progressively stronger warning colours for older buckets. Reserve the strongest colour for the oldest or highest-risk balances rather than colouring every outstanding amount red.
The Connectorly contacts table also provides fields such as Average Days To Pay, Payment Trend and Days Change versus the previous financial year. These can be added as tooltips or optional columns to show whether a customer’s payment behaviour is improving. The complete field list is available in the Connectorly Xero contacts data dictionary.
3. Add Invoice-Level Detail and Links Back to Xero
Place a second table beneath the customer summary so users can see the transactions behind each balance.
Include:
Contact Name
Invoice Number
Internal URL
Invoice Date
Due Date
Description
Amount Paid
Amount Credited
Amount Due (RC)
The relevant remaining or ageing value
Configure the customer matrix to filter this invoice table. When a user selects a customer or ageing amount, the lower table should immediately show the records contributing to that selection.
Set the Internal URL field’s data category to Web URL and display it as an icon. This creates the Open in Xero link shown in the Connectorly template, allowing an authorised user to move directly from the Power BI result to the underlying invoice or credit note in Xero.
Decide whether the table should show one row per invoice or one row per invoice line. Including Description, Product Code, Account or tracking fields creates line-level detail, so the same invoice number may appear more than once. This is useful when users need to understand what was sold, but it can make the table longer.
For a compact collection list, omit the line-level fields and group the report by Invoice Number. For detailed investigation, retain the descriptions and other invoice-line attributes.
Finally, sort the table by the oldest due date or largest outstanding amount. Finance teams should see the items requiring attention without manually searching through every open invoice.
4. Add KPI Cards and Collection Priorities
Add a small group of KPI cards above the customer matrix. Keep them focused on decisions rather than filling the page with every available measure.
The most useful cards are:
Total Amount Due: the complete outstanding customer balance.
Remaining Past Due: the portion that is already overdue.
Overdue Percentage: overdue balance divided by total amount due.
Remaining Credit: unapplied customer credits that may affect collection work.
Overdue Customers: the distinct number of customers with a past-due balance.
Average Days to Pay: the historical time customers take to settle invoices.
Use the same reporting currency and filter context across every card. Selecting an organisation or customer should update the KPIs, customer matrix and invoice table together.
A separate ageing visual can show how the total balance is distributed across the current, 30-day, 60-day and 90-day intervals. A horizontal bar or stacked column chart works well because users can compare the size of each bucket without reading every customer row.
Collection priority should consider both value and age. A large current invoice may be important for cash forecasting but does not require the same action as a smaller balance that has been overdue for more than 90 days. Tooltips can add context such as lifetime sales, last sales activity, average days to pay and payment trend.
Connectorly templates also contain reusable customer and financial calculations. Our guide to prebuilt Power BI measures for Xero reporting explains how several of these measures work, including Days Sales Outstanding.
How to Reconcile the Power BI Dashboard with Xero
Reconciliation should happen before the dashboard is shared with decision-makers.
In Xero, open Reporting → All reports → Aged Receivables Summary. Then make the comparison as controlled as possible:
Select the same Xero organisation shown in Power BI.
Use the same reporting date.
Age balances by the same method, preferably due date for collection reporting.
Confirm that both reports use the same currency.
Remove tracking, customer and organisation filters.
Refresh the Connectorly data and then refresh the Power BI semantic model.
Compare the overall outstanding balance.
Compare each ageing bucket.
Compare balances by customer.
Investigate individual invoices only after the higher-level totals have been checked.
Xero’s report can include approved outstanding invoices, credit notes and overpayments as at the selected report date. Therefore, a comparison based only on original invoice totals will not reconcile correctly. Power BI must use the remaining balance after payments and credits.
Also check the Data current as of timestamp. A payment entered in Xero after Connectorly’s latest synchronisation will remain outstanding in Power BI until the source data and semantic model have both refreshed.
When a difference appears, avoid changing calculations immediately. First determine whether it comes from timing, filters, accounting treatment, currency or transaction status. Then narrow the comparison to one customer and one invoice.
For a complete troubleshooting process, follow our guide to why Power BI numbers don’t match Xero. It explains how to isolate refresh, relationship, filter and calculation problems systematically.
Common Aged Receivables Dashboard Mistakes
Even a well-designed dashboard can produce misleading results if the underlying logic is inconsistent.
The most common mistakes are:
Using the original invoice total: ageing should normally use the remaining amount after payments and applied credits.
Confusing invoice date with due date: invoice-date ageing shows how old a document is, while due-date ageing shows how late the payment is.
Including draft or forecast invoices: these may be useful for forecasting but should not automatically appear as recognised receivables.
Ignoring credits and overpayments: unapplied amounts can materially change the customer’s net position.
Mixing currencies: transaction-currency amounts from different organisations cannot be added meaningfully without conversion.
Counting invoices more than once: line-level detail can show the same invoice number on several rows. Use Connectorly’s proportionally allocated fields and aggregate them consistently.
Hiding the refresh timestamp: users may assume that a newly recorded Xero payment is already reflected in Power BI.
Using inconsistent filters: customer, organisation, tracking and status filters must apply consistently across KPI cards, matrices and invoice tables.
Another important distinction is current versus historical ageing. Connectorly’s ready-made remaining fields show the position based on the latest available Xero data. If you need to recreate what receivables looked like at a previous month-end, the model must evaluate invoices, payments and credits as they existed at that historical date. Simply applying an old date filter to today’s remaining balance will not recreate the earlier position.
For most collection dashboards, a current snapshot is the correct choice. Historical ageing should be treated as a separate reporting requirement with its own validated calculation logic.
How Connectorly Simplifies Xero Receivables Reporting
Building an aged receivables dashboard directly from raw accounting data requires careful handling of invoice lines, payments, credits, statuses, currencies and customer relationships. Connectorly prepares this structure before the data reaches the report.
The Connectorly Xero data model provides:
Normalised invoice values regardless of whether the original Xero invoice was tax-inclusive or tax-exclusive.
Remaining, paid and credited amounts allocated consistently across invoice lines.
Ready-made overdue and ageing values.
Relationships between invoices, contacts, organisations and dates.
Reporting-currency values for multicurrency and multi-organisation analysis.
Derived customer information such as lifetime sales, last activity and average days to pay.
Direct links from Power BI records to the corresponding transactions in Xero.
A refresh timestamp that makes data currency visible.
A free, customisable Aged Debtors and Creditors Power BI template.
This allows finance teams to spend more time analysing receivables and less time rebuilding the underlying Xero data structure.
The template can be used without changing its original design, or it can become the starting point for a tailored collection dashboard. Organisations can add account-manager ownership, collection notes, customer segments, credit limits or CRM information while retaining the Connectorly model as the financial foundation.
If you want to explore the model with your own Xero data, visit Connectorly for Xero and Power BI to review the connection and available reporting options.
Final Thoughts
An aged receivables dashboard should do more than display unpaid invoices. It should help finance teams understand collection risk, identify the customers requiring attention and move quickly from a summary balance to the underlying Xero transaction.
The key is to use the remaining balance, apply a consistent ageing method and reconcile the result before distributing the report. Refresh timing, credits, partial payments, currencies and invoice-level detail all affect whether the dashboard agrees with Xero.
Connectorly provides the underlying Xero data model, ageing fields, customer measures and Power BI template needed to create this view without rebuilding the accounting structure from scratch. The supplied template can be used immediately or adapted to include organisation-specific KPIs, collection workflows and additional business data.
Start with one organisation and a current snapshot that reconciles completely. Once that foundation is trusted, the same model can support multiple Xero organisations, reporting currencies and more advanced customer analysis.
Frequently Asked Questions
What is an aged receivables dashboard?
An aged receivables dashboard shows how much customers owe and groups outstanding balances according to their age. It normally separates current balances from amounts that are 1–30, 31–60, 61–90 and more than 90 days overdue. It can also show customer-level totals and the invoices behind each balance.
Does Xero already provide an aged receivables report?
Yes. Xero’s Aged Receivables Summary report shows the amount each customer owes and how long the balance has been outstanding. Power BI becomes useful when organisations need customised KPIs, interactive investigation, multi-organisation reporting, wider distribution or analysis alongside information from other systems.
Should receivables be aged by invoice date or due date?
Due-date ageing is normally more useful for collection reporting because it measures how late the customer is paying. Invoice-date ageing measures how long the invoice has existed. Either method can be used, but Xero and Power BI must apply the same method when their figures are compared.
Can the dashboard combine multiple Xero organisations?
Yes. Connectorly retains the Xero organisation identity through the Connection Name field and provides reporting-currency values for combined analysis. Reconcile each organisation separately before accepting the group total, and avoid adding transaction-currency values when the underlying organisations use different currencies.
Why might the Power BI dashboard not match Xero?
Common causes include different reporting dates, ageing methods, currencies, filters or refresh times. Differences can also result from using original invoice totals instead of remaining balances, excluding credits or counting invoice values more than once. Start with one organisation, customer and invoice to isolate the cause.
Do I need to write DAX to use the Connectorly dashboard?
No. Connectorly’s Aged Debtors and Creditors template already includes the required data model, relationships, ageing fields and report structure. You can connect the template to your own Xero data and use it immediately. DAX is only necessary when you want to introduce additional organisation-specific KPIs or specialised reporting logic.