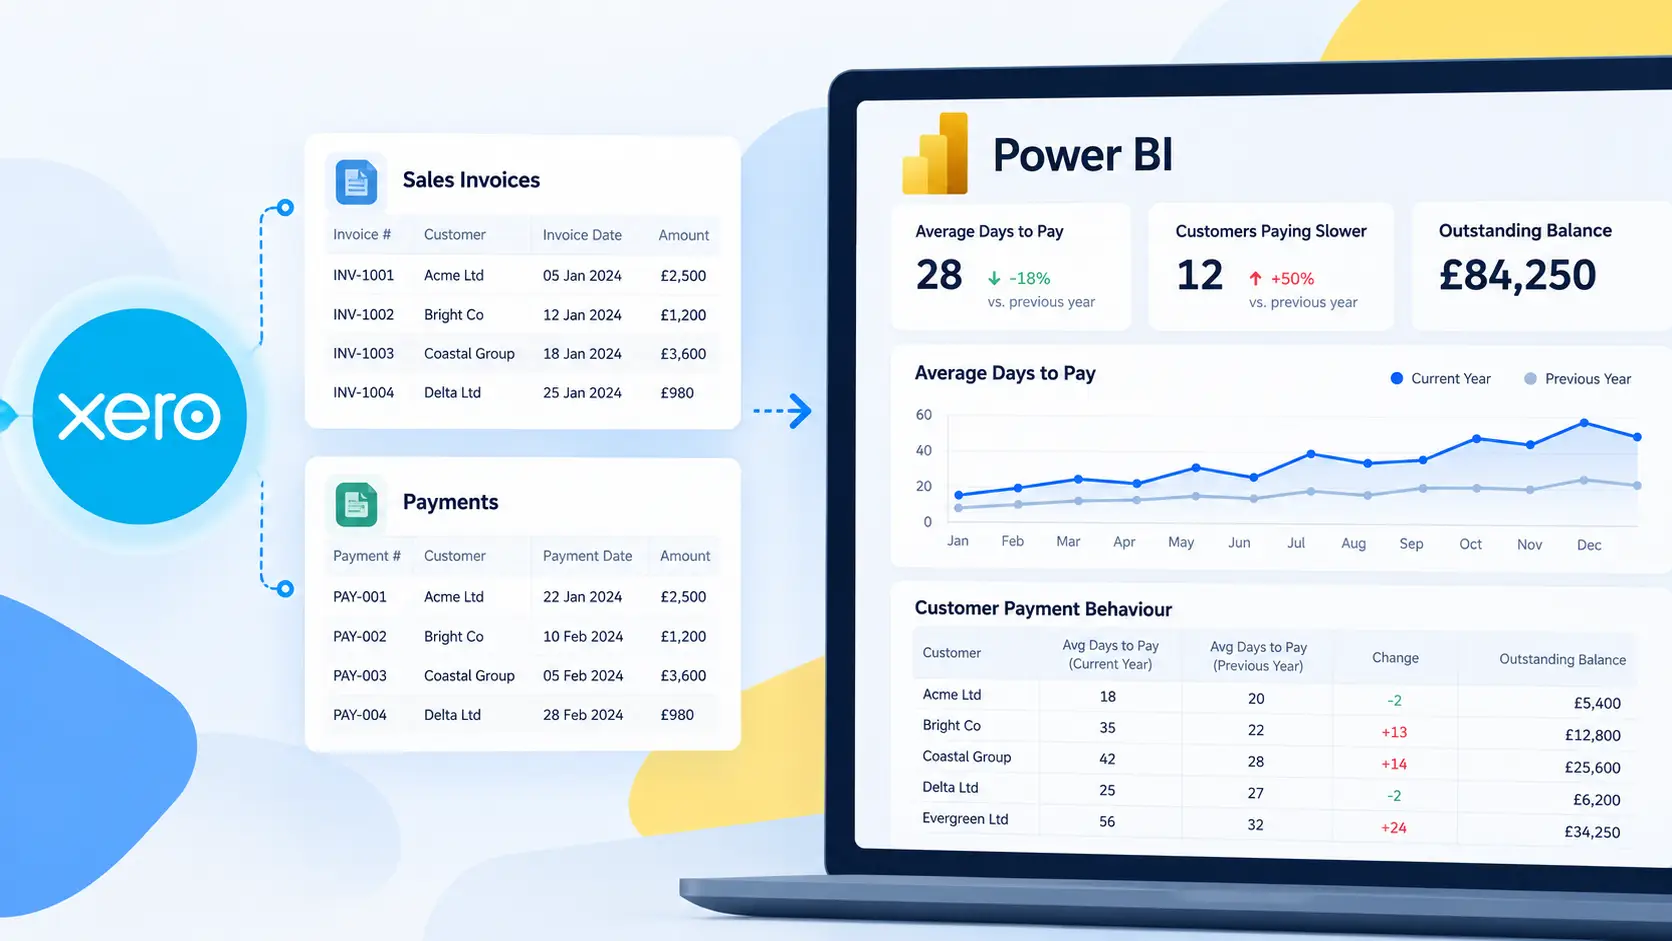
Everything you need to know about reporting on Xero data—from built-in reports and Xero Analytics to interactive Power BI dashboards.
Introduction
Xero is one of the world’s most popular cloud accounting platforms, trusted by millions of businesses, accountants and bookkeepers. It provides an excellent foundation for managing day-to-day finances, producing statutory reports and keeping business owners informed about their financial performance.
Over the last few years, Xero has significantly expanded its reporting capabilities. Alongside its traditional accounting reports, it now offers Xero Analytics powered by Syft, providing visual dashboards, benchmarking, cash flow forecasting and AI-assisted insights. For many small businesses, these built-in tools provide everything needed to monitor financial performance.
However, as organisations grow, reporting requirements often become more sophisticated.
Finance teams may need to combine data from multiple Xero organisations, analyse information alongside CRM or operational systems, build dashboards for different departments, or provide executives with highly customised reports. These requirements often extend beyond standard accounting reports and require a dedicated business intelligence platform.
This is where Microsoft Power BI becomes a natural complement to Xero.
Rather than replacing Xero, Power BI allows organisations to build interactive dashboards, analyse historical trends, combine multiple data sources and create reports tailored to the needs of finance teams, management and business owners.
In this guide, we’ll explore:
- what reporting capabilities Xero provides today
- when Xero’s native reports are sufficient
- when organisations typically move to Power BI
- how Xero data can be connected to Power BI
- the types of dashboards you can build
- best practices for creating reliable financial reports
- common reporting mistakes to avoid
Whether you’re an accountant, finance manager, business owner or Power BI developer, this guide will help you understand the strengths of both platforms and choose the right reporting approach for your organisation.
Table of Contents
What is Xero Reporting?
At its core, Xero reporting is the process of turning the financial data stored in your Xero organisation into meaningful information that supports business decisions.
Every invoice, bill, payment, bank transaction and journal recorded in Xero contributes to a growing dataset that can be used to understand how a business is performing. Reporting transforms that data into financial statements, management reports and dashboards that answer questions such as:
- Are we profitable?
- How much cash do we have available?
- Which customers owe us money?
- Which suppliers need to be paid?
- How has revenue changed over time?
- Which departments or tracking categories are performing best?
- Are we meeting our budget?
Different people within a business often require different types of reports.
An accountant may focus on preparing statutory financial statements and ensuring accounts reconcile correctly. A finance manager may want detailed variance analysis and cash flow forecasting. A managing director may simply need a high-level dashboard showing revenue, profit, cash position and outstanding receivables.
Understanding these different reporting needs is important because no single report answers every business question.
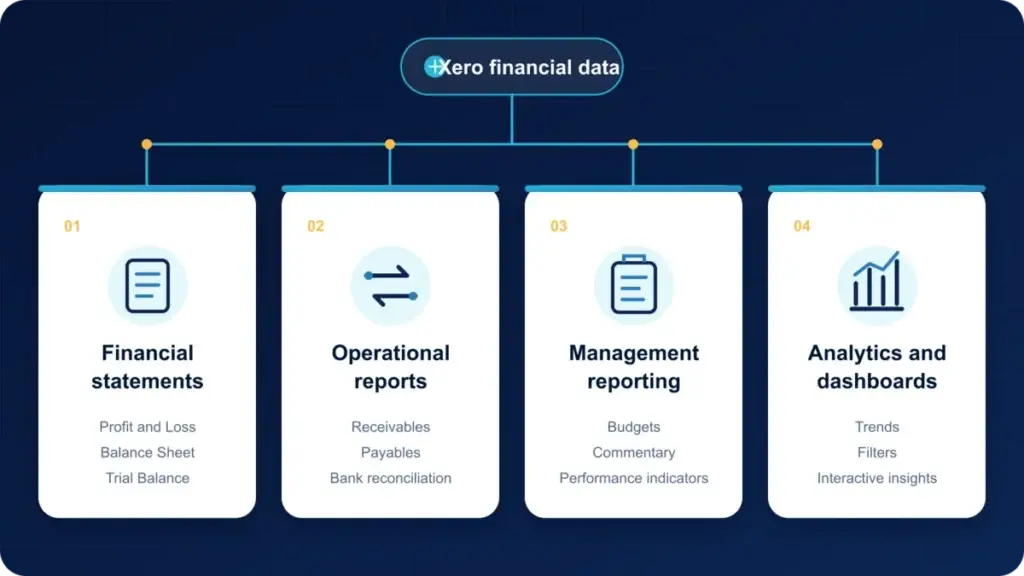
Broadly speaking, Xero reporting falls into four categories:
Financial Statements
These are the core accounting reports that most businesses rely on, including the Profit and Loss report, Balance Sheet and Trial Balance. They provide an overview of the organisation’s financial position and are commonly used for compliance, tax preparation and financial review.
Operational Reports
Operational reports focus on the day-to-day running of the business. Examples include Accounts Receivable ageing, Accounts Payable ageing, bank reconciliation reports, invoice listings and transaction reports. These help finance teams manage cash flow and monitor outstanding work.
Management Reporting
Management reporting combines financial information with commentary, budgets, comparisons and key performance indicators. These reports are typically prepared monthly or quarterly for directors and senior management to support strategic decision-making.
Analytics and Dashboards
Modern reporting increasingly focuses on interactive dashboards rather than static reports. Dashboards allow users to filter information, drill into transactions, compare periods and monitor KPIs in real time.
Xero now includes built-in analytics capabilities, while platforms such as Microsoft Power BI provide much greater flexibility for creating bespoke dashboards and combining financial data with information from other business systems.
The key point is that reporting is no longer just about producing financial statements. Modern organisations expect reporting to provide insights, identify trends and support better business decisions.
What Reporting Tools Does Xero Provide?
One of the biggest misconceptions about Xero is that it only offers a handful of basic financial reports.
That may have been true many years ago, but today’s Xero reporting platform is considerably more capable. Businesses can produce traditional accounting reports, create customised management reports and use interactive analytics dashboards without leaving the Xero environment.
Understanding what Xero already offers is important before deciding whether additional reporting tools such as Power BI are required.
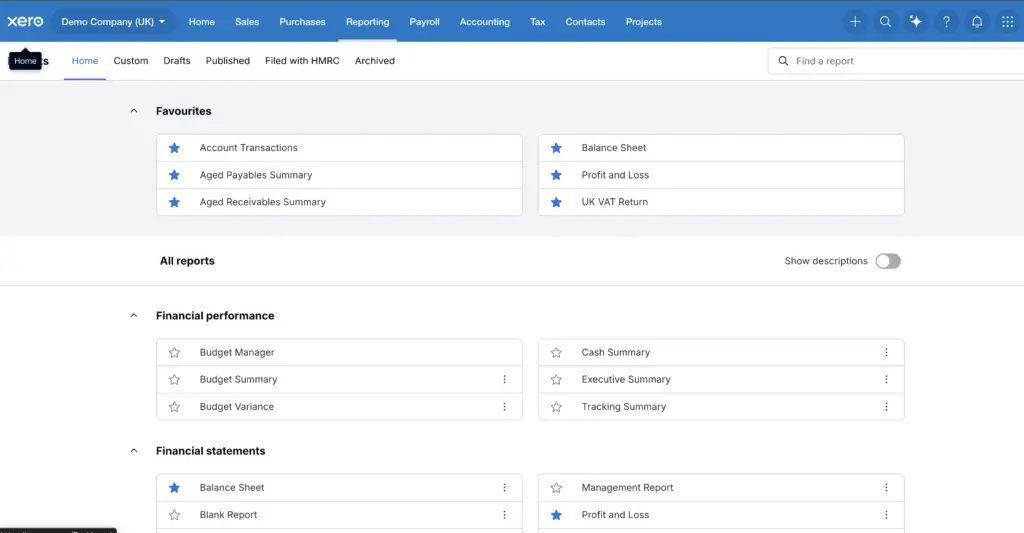
Standard Financial Reports
Xero includes a comprehensive library of built-in accounting reports designed for everyday financial management.
Some of the most commonly used reports include:
- Profit and Loss
- Balance Sheet
- Trial Balance
- Trial Balance by Date Range
- Cash Summary
- Statement of Cash Flows (where available)
- General Ledger
- Journal Report
- Bank Reconciliation Summary
- Aged Receivables
- Aged Payables
- Budget Variance
- Account Transactions
- GST and VAT reports
- Tax reports
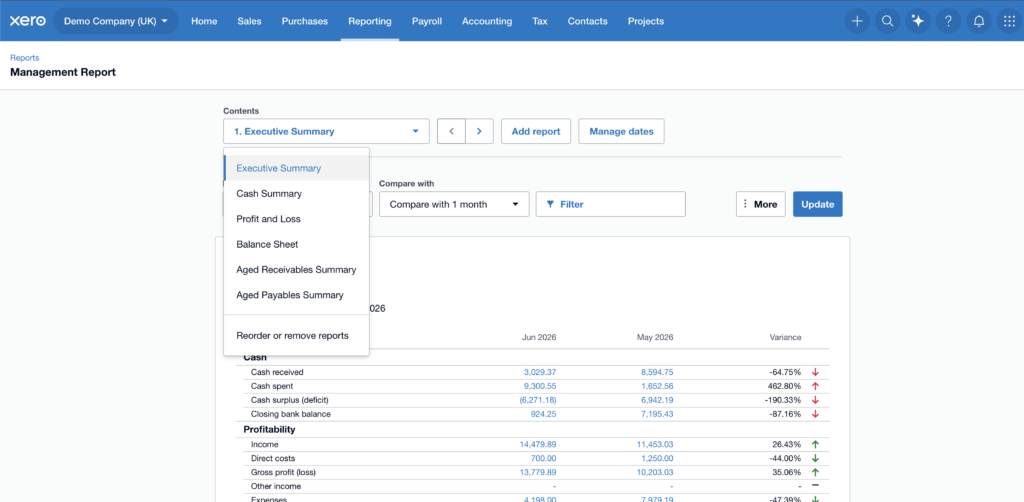
These reports are highly configurable. Users can customise date ranges, comparison periods, layouts, account groupings and report formatting before saving them as reusable templates.
For many small and medium-sized businesses, these reports provide all the financial information required for routine accounting and compliance.
Custom Reports and Management Reports
Xero also allows users to create customised reports that go beyond the standard layouts.
Finance teams can:
- rearrange report layouts
- create custom account groups
- add formulas and calculated rows
- compare multiple reporting periods
- save custom report templates
- build professional management report packs
- include commentary and notes alongside financial statements
Management Reports are particularly useful for organisations that produce monthly board packs or reports for external stakeholders. Instead of sending multiple individual reports, users can combine several financial statements into a single professionally formatted report with explanatory commentary.
Xero Analytics
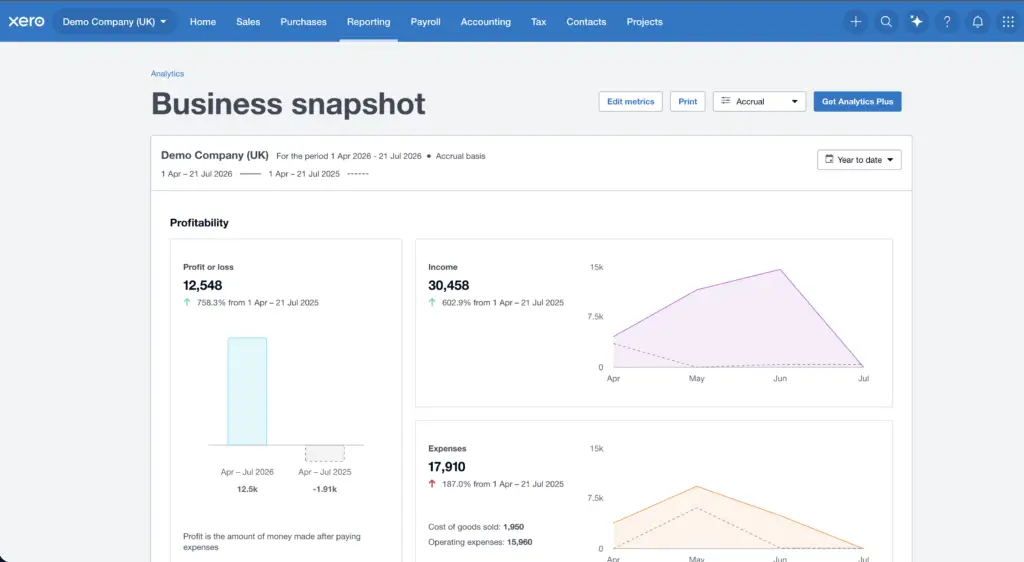
One of the most significant additions to Xero’s reporting platform is Analytics, which incorporates technology and capabilities developed through Syft.
Rather than replacing traditional financial reports, Xero Analytics provides a visual layer that helps users understand trends and business performance more quickly.
Depending on your Xero subscription and region, Analytics features may include:
- interactive financial dashboards
- revenue and profitability trends
- cash flow forecasting
- business health indicators
- industry benchmarking
- scenario planning
- AI-generated financial insights
- custom dashboard layouts
For many business owners, these dashboards provide a much more accessible way to understand financial performance than reviewing traditional accounting reports alone.
Xero continues to invest heavily in Analytics, and new features are released regularly. As a result, organisations evaluating reporting solutions should consider both Xero’s native capabilities and external business intelligence platforms before deciding which approach best meets their needs.
When Are Xero’s Native Reports Enough?
For many businesses, Xero’s native reporting tools provide everything needed to monitor financial performance, manage day-to-day accounting and prepare regular management reports.
The decision to introduce another reporting platform should therefore be based on specific business requirements—not an assumption that every organisation using Xero also needs Power BI.
You Are Reporting on One Xero Organisation
Native reporting is often sufficient when a business operates through a single Xero organisation.
Finance teams can produce financial statements, compare reporting periods, analyse tracking categories and prepare reports without moving data into another platform.
The process also remains relatively straightforward because there is no need to align different charts of accounts, currencies, reporting calendars or organisation structures.
Standard Financial Statements Meet Your Requirements
Xero is particularly strong when the main requirement is producing established accounting reports, including:
- Profit and Loss
- Balance Sheet
- Trial Balance
- Cash Summary
- General Ledger
- Aged Receivables
- Aged Payables
- Budget Variance
These reports are designed around the accounting data held in Xero and can be configured for different dates, comparison periods and accounting bases.
If they answer the questions being asked by business owners, accountants and managers, creating a separate business intelligence environment may add unnecessary complexity.
Reporting Is Primarily Accounting-Focused
Xero’s native tools are most effective when reporting requirements remain closely connected to accounting processes.
Examples include:
- Reviewing monthly financial performance
- Monitoring outstanding invoices and bills
- Preparing information for tax or compliance work
- Reviewing bank reconciliation
- Comparing actual results with budgets
- Producing reports for directors or external advisers
Because these activities take place inside the accounting platform, users can move directly between reports and the underlying financial records.
Your Reports Follow a Consistent Format
Custom reports and report packs can work particularly well for businesses that prepare the same monthly or quarterly information each period.
Reports can be adjusted for different date ranges, comparison periods and account groupings. Depending on the report and the user’s permissions, layouts may also include formulas, schedules, commentary and additional sections.
If management is comfortable receiving a structured report rather than exploring information interactively, this approach may be entirely sufficient.
You Only Need a Limited Number of Custom Measures
Not every business requires a large library of specialised KPIs.
Xero reports and its visual reporting features can support many common financial measures, comparisons and performance indicators. Custom report layouts can also include account groups, formulas and calculated rows.
Native reporting may therefore be enough when the required calculations are based mainly on Xero accounts and transactions.
The need for a dedicated business intelligence platform becomes more relevant when calculations depend on complex business rules, reusable data models or information held outside Xero.
Xero’s Visual Reporting Provides the Insight You Need
Businesses that want visual reporting do not necessarily need to move directly to Power BI.
Features such as the Business snapshot and Analytics can provide dashboards, performance trends, profitability information and cash-flow insights within the Xero environment. Availability can vary according to subscription, region and user permissions.
For business owners who want an accessible overview of one organisation, these capabilities may provide the right balance between detail and simplicity.
Reports Do Not Need Data from Other Systems
Native Xero reporting is most suitable when the questions being asked can be answered using information already available within Xero.
For example:
- How profitable was the business last month?
- How much cash is currently available?
- Which customers have overdue invoices?
- How do actual results compare with budget?
- Which tracking category generated the most revenue?
Reporting requirements become more complex when financial information needs to be combined with CRM, payroll, project-management, marketing or operational data.
If no such combination is required, keeping reporting within Xero can reduce implementation effort and ongoing maintenance.
Only a Small Group Needs Access
Xero reports can work well when information is primarily used by business owners, accountants, bookkeepers and a small management team.
A separate reporting platform becomes more relevant when different departments need tailored dashboards, access must be controlled by role, or reports need to be distributed across a larger organisation.
A Practical Decision
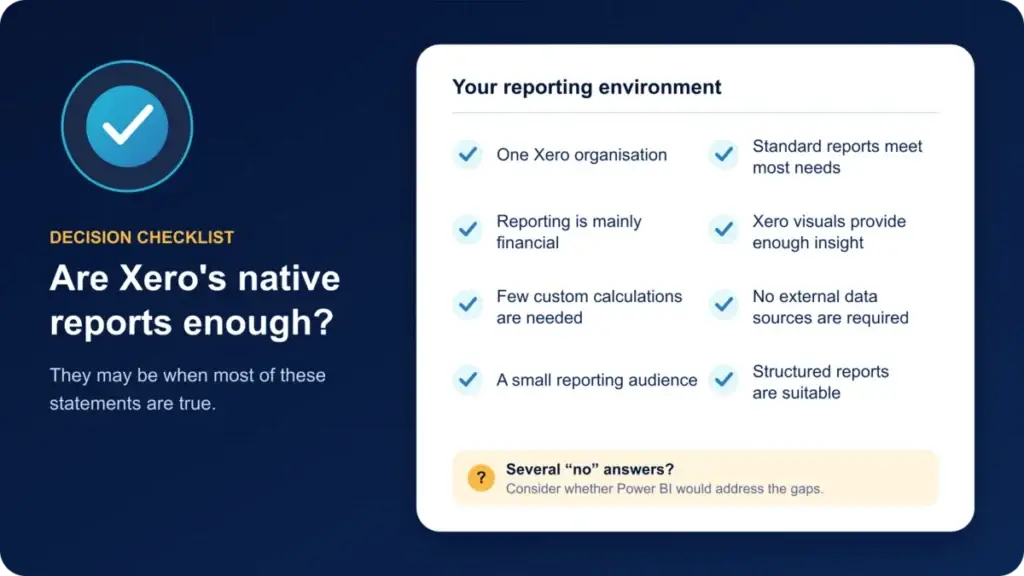
Xero’s native reports are likely to be sufficient when:
- You report on one organisation.
- Standard accounting reports meet most requirements.
- Reporting is mainly financial rather than operational.
- Xero’s visual reporting provides enough insight.
- Only a few custom calculations are required.
- Data does not need to be combined with other platforms.
- Reports are used by a relatively small audience.
- A structured report is suitable for management.
There is little benefit in introducing additional reporting technology unless it solves a genuine problem.
However, when an organisation needs consolidated reporting, specialised KPIs, interactive exploration, wider distribution or data from several business systems, Power BI may become a more appropriate addition to the reporting environment.
When Should You Consider Power BI?
Power BI becomes valuable when reporting requirements extend beyond the information, structure or audience supported by reports inside Xero.
This does not mean replacing Xero. Xero remains the accounting system where financial transactions are recorded, reconciled and managed. Power BI provides an additional reporting environment in which that data can be modelled, combined and presented for different business requirements.
The decision should be driven by the questions the organisation needs to answer.
You Need to Report Across Multiple Xero Organisations
Businesses operating through several companies, subsidiaries, branches or client organisations often need a combined view of financial performance.
Management may want to compare organisations side by side or see consolidated measures such as:
- Total revenue
- Gross and net profit
- Cash position
- Outstanding receivables
- Budget performance
- Results by company, region or business unit
Power BI can bring information from multiple organisations into one reporting model while retaining an identifier for each Xero organisation.
However, combining the data is only the first step. Reliable consolidated reporting may also require account mapping, consistent reporting periods, currency conversion and the treatment of intercompany transactions.
You Need Custom Financial or Operational KPIs
Standard financial statements are designed to answer established accounting questions. Management teams often need additional measures based on the way their organisation operates.
Examples include:
- Customer acquisition cost
- Customer lifetime value
- Revenue per employee
- Average invoice value
- Average days to pay
- Recurring revenue
- Project profitability
- Sales conversion rate
- Revenue by service or product
- Performance against operational targets
Power BI allows calculations to be defined centrally and reused across reports. This can help ensure that departments work with consistent definitions rather than calculating the same KPI differently in separate spreadsheets.
You Need to Combine Xero with Other Systems
One of the strongest reasons to consider Power BI is the need to analyse financial information alongside data held outside Xero.
An organisation might want to combine Xero with:
- A CRM platform such as HubSpot or Dynamics 365
- Payroll or workforce information
- Project-management software
- Marketing platforms
- Inventory or operational systems
- Microsoft 365
- Budgets and forecasts stored in Excel
- Industry-specific applications
Combining these sources allows businesses to answer broader questions.
For example, finance and sales data could be used together to analyse revenue by sales pipeline, customer acquisition cost or conversion performance. Project and accounting data could be combined to compare time, costs, invoicing and profitability.
These questions usually cannot be answered from accounting data alone.
If your CRM is HubSpot, follow our practical guide to combining Xero and HubSpot data in Power BI. It explains how to load both datasets, match customers safely and create relationships that allow CRM selections to filter Xero results.
Different Users Need Different Dashboards
A single financial report rarely meets the needs of every person in an organisation.
A finance director may require detailed Profit and Loss, Balance Sheet and cash-flow analysis. A sales manager may want customer revenue, pipeline and conversion measures. A managing director may only need a concise overview of revenue, profit, cash and outstanding debt.
Power BI allows different report pages or dashboards to be created from the same underlying data model. This means information can be tailored to each audience without creating separate manual reporting processes.
Users Need Interactive Exploration
Published financial reports are effective when readers need a consistent and controlled presentation.
Power BI is more suitable when users need to interact with the information by:
- Filtering by company, region or department
- Changing the reporting period
- Drilling from a summary into detailed records
- Comparing different categories
- Exploring trends over time
- Moving between related report pages
- Investigating the transactions behind a result
Interactive exploration can help users answer follow-up questions without asking the finance team to produce another version of the report.
You Need More Historical Analysis
Businesses often want to analyse performance across several years, identify seasonal patterns or compare results using custom reporting calendars.
Power BI can support reusable date models, rolling periods and calculations such as:
- Month-to-date
- Quarter-to-date
- Year-to-date
- Previous-period comparisons
- Rolling 12-month results
- Year-on-year growth
- Cumulative totals
- Financial-year comparisons
This is particularly useful when the same time-based calculations need to be applied consistently across several dashboards and KPIs.
Reports Need Wider Distribution and Controlled Access
As an organisation grows, financial and operational reporting may need to reach a larger audience.
Power BI supports shared workspaces, apps and role-based security. Depending on the organisation’s licensing and configuration, reports can be distributed while controlling which information different users are permitted to view.
For example, regional managers could use the same report while only seeing information associated with their region.
This can be more manageable than creating and distributing multiple versions of a spreadsheet or report pack.
You Want a Reusable Reporting Model
Accountants, consultants and larger finance teams may need to apply a consistent reporting approach across multiple businesses or clients.
A reusable Power BI model can provide:
- Standard account groupings
- Consistent financial calculations
- Shared KPI definitions
- Common report layouts
- Repeatable validation procedures
- A foundation for customised client reports
The model can then be adapted where an organisation has different account structures, reporting calendars or management requirements.
A Practical Decision
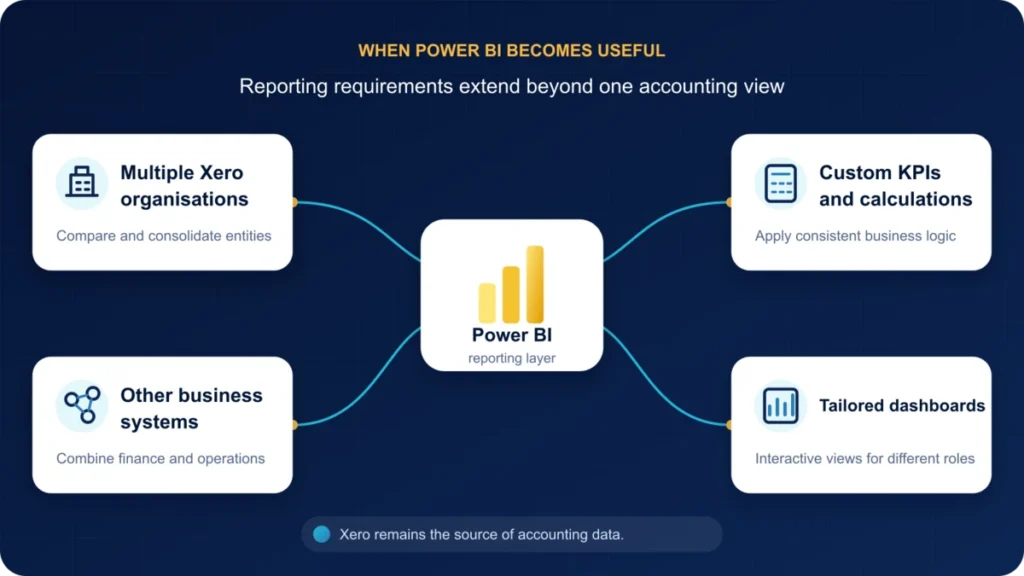
Power BI may be appropriate when:
- You need to report across multiple Xero organisations.
- Xero data must be combined with another business system.
- Management requires specialised KPIs.
- Different users need tailored dashboards.
- Interactive filtering and drill-down are important.
- Reports must be shared across a wider organisation.
- Historical and trend analysis needs to be more flexible.
- A reusable reporting model is required.
Power BI should solve a defined reporting problem rather than being introduced simply because it offers more features.
For many organisations, the most effective approach is to continue using Xero for accounting workflows and standard financial statements while using Power BI for wider analysis, customised dashboards and cross-system reporting.
Xero Reporting Versus Power BI
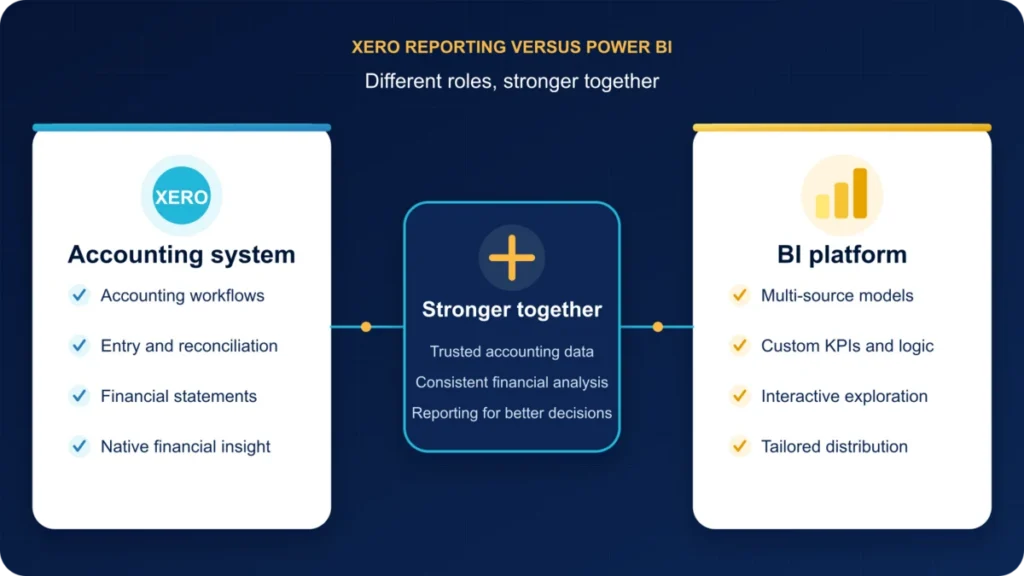
Xero and Power BI are designed for different purposes.
Xero is an accounting platform. Its reporting tools are built around financial records, accounting workflows and the transactions held inside a Xero organisation.
Power BI is a business intelligence platform. It allows organisations to model, combine, visualise and distribute information from many different sources—including Xero.
The following comparison shows where each platform is strongest.
Requirement | Xero | Power BI |
Bookkeeping and accounting | This is Xero’s primary purpose. Transactions can be entered, reconciled and managed inside the platform. | Power BI is not an accounting system and should not be used to enter or reconcile transactions. |
Standard financial statements | Provides established reports such as Profit and Loss, Balance Sheet, Trial Balance and Cash Summary. | Financial statements can be created, but they require an appropriate data model, account structure and calculation logic. |
Custom report layouts | Financial reports can support configurable layouts, account groups, formulas, schedules and comparison periods. | Report pages and visuals are highly customisable, but the underlying financial model must first be built or adopted. |
Dashboards and visual analysis | Available through features such as the Business snapshot and Analytics, depending on subscription, region and permissions. | Provides extensive flexibility for building interactive, multi-page reports and dashboards. |
Multiple Xero organisations | Each organisation has its own accounting environment. Group reporting depends on the approach and additional tools being used. | Data from multiple organisations can be combined, compared and consolidated within a shared reporting model. |
Multiple data sources | Reporting is primarily based on information held in Xero, together with data supported by specific Xero features. | Combining information from databases, files, cloud services and business applications is a core capability. |
Custom calculations | Supports report formulas and calculations available through Xero’s reporting and Analytics features. | DAX, Power Query and reusable data models support specialised calculations and business rules. |
Interactive exploration | Reports and visual features provide filtering and analysis within the Xero environment. | Users can filter, drill through, cross-highlight visuals and navigate between related report pages. |
Data transformation | Offers reporting options based on the structure of data inside Xero. | Power Query can be used to clean, reshape, combine and map information before it reaches the report. |
Operational reporting | Suitable where the required operational information is already held in Xero. | Can combine finance with CRM, payroll, project, marketing and other operational data. |
Sharing and distribution | Reports can be viewed, exported, saved or published according to the report and the user’s permissions. | Reports can be published through the Power BI service and distributed using workspaces and apps, subject to licensing and access controls. |
Role-specific reporting | Access is managed through Xero roles and permissions, while report content is generally centred on accounting workflows. | Different report pages and security rules can support tailored experiences for departments, regions and user groups. |
Technical setup | Standard reports are available without building a separate data model. | Reliable Xero reporting requires a suitable connection, data model, calculations and validation process. |
Ongoing maintenance | Xero maintains its standard reporting functionality as part of the accounting platform. | The organisation is responsible for maintaining its reports, models, refresh processes and business definitions unless these are provided through a managed solution. |
The Main Difference
The most important distinction is not which platform has more features. It is where the reporting needs to take place and what information it must include.
Xero is usually the better environment for:
- Accounting workflows
- Standard financial statements
- Reconciliation and transaction review
- Routine financial reporting
- Reports used mainly by accountants, bookkeepers and business owners
Power BI becomes more appropriate for:
- Cross-system reporting
- Consolidated analysis
- Specialised KPIs
- Interactive exploration
- Wider organisational distribution
- Role-specific dashboards
- Reusable reporting models
Using Xero and Power BI Together
In many organisations, Xero and Power BI are complementary rather than competing platforms.
Xero remains the source of accounting data and the place where financial records are entered, reviewed and reconciled. Power BI uses that information to support broader analysis and reporting.
For example, an accountant may continue to use Xero’s Profit and Loss and Balance Sheet reports for month-end review. At the same time, directors could use a Power BI dashboard that combines financial results with sales, project or operational information.
The right choice is therefore not always Xero or Power BI. It may be Xero for accounting and standard financial reporting, with Power BI added where the organisation requires greater modelling flexibility, additional data sources or a different reporting experience.
How Does Xero Data Reach Power BI?
Power BI cannot report on Xero information until the underlying data has been made available in a format it can access and model.
There are three main approaches:
- Exporting data manually
- Building a direct connection using the Xero API
- Using a managed third-party connector
Each approach can be appropriate in different circumstances. The main differences are the amount of technical work required, the reliability of refreshes and how easily the solution can grow.
Manual Export
The simplest approach is to export reports or transaction data from Xero and import the resulting file into Power BI.
A typical process might involve:
- Running a report in Xero.
- Exporting the results to Excel or CSV.
- Saving the file in a known location.
- Importing it into Power BI.
- Cleaning and modelling the data.
- Repeating the process when the report needs updating.
Manual exports can be suitable for:
- One-off analysis
- Small proof-of-concept reports
- Infrequently updated information
- Situations where only a limited dataset is required
- Early testing before an automated solution is introduced
This approach is easy to understand and does not require API development.
However, it becomes difficult to maintain when reports need to refresh regularly or combine information from several organisations. Files can be missed, overwritten or exported with different settings. Manual processes also create version-control problems and make it harder to demonstrate that every report is based on the latest available data.
The exported report may also contain summarised information rather than the detailed transaction records required for deeper analysis.
Direct API Development
A more technical approach is to retrieve data directly from Xero’s Accounting API.
The API provides access to accounting records and selected report endpoints. Depending on the reporting requirement, a solution may retrieve information such as:
- Accounts
- Invoices and invoice lines
- Credit notes
- Payments
- Contacts
- Bank transactions
- Journals
- Tracking categories
- Items
- Budgets
- Selected financial reports
A direct integration provides significant control over which endpoints are used, how records are filtered and where the data is stored.
However, the connection must be designed and maintained.
This normally involves:
- Registering and configuring an application
- Managing OAuth 2.0 authentication
- Requesting the appropriate permissions
- Handling pagination and API limits
- Flattening nested responses into reporting tables
- Managing incremental data retrieval
- Creating relationships between entities
- Monitoring failed or incomplete refreshes
- Updating the integration when requirements change
Xero’s report endpoints can provide useful financial summaries. Transaction-level Power BI reporting may require retrieving and modelling the individual records behind those summaries.
For example, a Profit and Loss endpoint may be useful when an application needs the resulting report structure. A more flexible Power BI model may instead use journals, accounts and related records so that users can apply custom periods, groupings and filters.
Direct API development can be appropriate when an organisation has experienced developers, needs specialised extraction logic or wants complete control over its data architecture.
The main trade-off is ongoing technical responsibility.
Managed Third-Party Connector
A managed connector sits between Xero and Power BI.
Instead of requiring Power BI to retrieve and interpret raw API responses during each refresh, the connector handles the collection and preparation of the data. Power BI then connects to a structured reporting source.
Depending on the service, a managed connector may handle:
- Xero authentication
- API requests and pagination
- Scheduled data collection
- Data storage
- Table structures and relationships
- Multiple Xero organisations
- Reporting currency
- Refresh monitoring
- Updates when the source API changes
This reduces the amount of integration code that must be created and maintained internally.
How Connectorly Connects Xero and Power BI
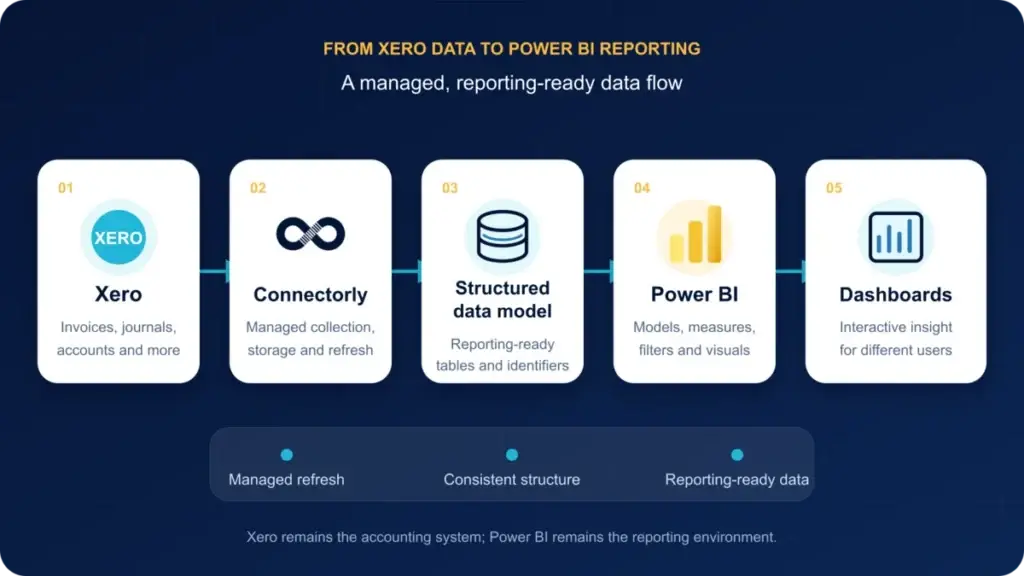
Connectorly is a managed integration designed specifically for reporting on Xero data in Power BI.
The general flow is:
- The user authorises Connectorly to access a Xero organisation.
- Connectorly retrieves the permitted accounting data from Xero.
- The information is organised into the Connectorly Xero Data Model.
- Power BI connects to the structured data source.
- Reports can be built from scratch or started from a prebuilt template.
- Connectorly refreshes the Xero data on a managed schedule.
The data model contains reporting tables for entities such as accounts, invoices, contacts, payments, journals and tracking categories. It also includes identifiers that allow records to remain associated with the correct Xero organisation.
This approach allows report developers to focus on financial modelling, calculations and visual design rather than maintaining the API connection itself.
Connectorly also applies automated reconciliation and regression testing to its financial reporting data. See how Xero data validation works in Power BI, including Profit and Loss, Balance Sheet and budget audit views that customers can query directly.
Connectorly does not replace Xero or Power BI. Xero remains the accounting platform, Connectorly manages the data connection and reporting structure, and Power BI provides the analytical and visual reporting environment.
Power BI provides the most complete Connectorly experience, including prebuilt models, measures, templates and documentation. However, because Connectorly makes the underlying data available in PostgreSQL, compatible reporting platforms can also query it. Learn how to use Connectorly without Power BI.
Which Connection Method Should You Choose?
A manual export may be sufficient when reporting is occasional, limited in scope and maintained by one person.
A direct API connection may be appropriate when the organisation has development resources and requires complete control over extraction, infrastructure and data processing.
A managed connector may be more suitable when the priority is reliable refresh, structured reporting data, multiple Xero organisations or reduced integration maintenance.
The choice should consider:
- How frequently reports must update
- How much data is required
- Whether transaction-level detail is needed
- The number of Xero organisations
- Available technical expertise
- Security and data-governance requirements
- The cost of ongoing maintenance
- Whether reports must remain reliable as requirements grow
Connecting Xero to Power BI is not only about retrieving data. The information must also be complete, structured, refreshed and modelled correctly before it can support trustworthy financial reporting.
Understanding the Xero Data Model
Connecting Xero to Power BI provides access to data, but reliable reporting also requires an understanding of how that data is structured.
Information displayed as one report inside Xero may be assembled from several related types of record. A Power BI model must preserve those relationships so that calculations remain accurate when users filter by date, account, contact, organisation or tracking category.
The exact tables and fields available depend on the connection method being used, but most Xero reporting models contain the following core entities.
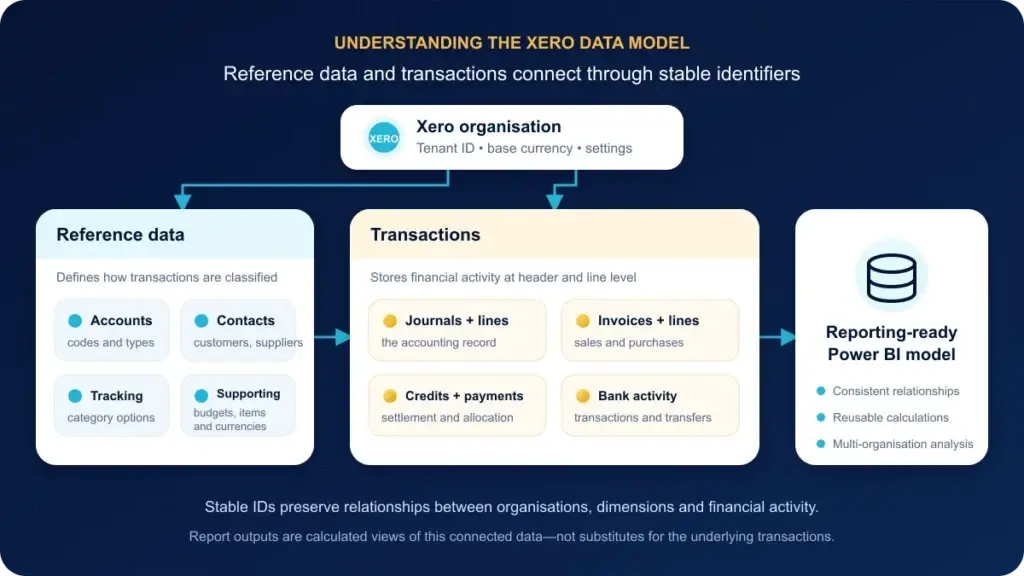
Chart of Accounts
The Chart of Accounts defines how financial transactions are classified.
Each account normally contains information such as:
- Account code
- Account name
- Account type
- Account class
- Tax treatment
- Status
- Currency, where relevant
- Reporting and system identifiers
Accounts determine where transactions appear within financial statements. Revenue and expense accounts contribute to the Profit and Loss report, while asset, liability and equity accounts contribute to the Balance Sheet.
When several Xero organisations are combined, account codes and names may not be consistent. A reporting model may therefore require an additional mapping structure that groups different accounts into common management-reporting categories.
Journals and Journal Lines
Journals provide the accounting entries created by transactions recorded in Xero.
A journal contains general information about the entry, while its journal lines contain the individual debit and credit amounts assigned to accounts.
Journal data is particularly important for:
- Profit and Loss reporting
- Balance Sheet reporting
- Trial Balance analysis
- Account movements
- Debit and credit analysis
- Opening and closing balances
- Financial-period comparisons
Power BI calculations must handle the sign and classification of journal amounts carefully. A positive value does not necessarily have the same financial meaning for every account type.
Journals also provide a different perspective from invoices. An invoice represents a business document, while its accounting effect is represented through the journal entries generated from that document.
Invoices and Invoice Lines
Invoices record amounts owed by customers, while bills record amounts owed to suppliers. Within Xero’s data structure, both may be represented through invoice records with different types.
The invoice header usually contains information such as:
- Contact
- Invoice number
- Invoice date
- Due date
- Status
- Currency
- Subtotal
- Tax
- Total
- Amount paid
- Amount due
Invoice lines contain the individual products, services, descriptions, quantities, prices, accounts, tax rates and tracking options that make up the document.
This distinction is important in Power BI.
Invoice-header data is suitable for measures such as the number of invoices, total invoice value and average days to pay. Invoice-line data is required when reporting by product, service, account or tracking category.
Combining header and line values incorrectly can cause invoice totals to be counted more than once.
Credit Notes
Credit notes reduce amounts previously charged to customers or billed by suppliers.
They must be handled correctly when calculating:
- Revenue
- Expenses
- Outstanding balances
- Customer sales
- Supplier costs
- Tax
- Profitability
A reporting model may store credit notes separately or combine them with invoices using a transaction type and appropriate sign logic.
Ignoring credit notes is a common reason Power BI totals fail to reconcile with Xero.
Payments
Payments record the settlement of invoices, bills and other transactions.
One invoice can have:
- No payments
- One complete payment
- Several partial payments
- Payments made on different dates
Payment data supports analysis such as:
- Paid versus unpaid invoices
- Collection time
- Payment history
- Cash received
- Cash paid
- Customer payment behaviour
The invoice date and payment date answer different questions. Revenue reporting may use the invoice or journal date, while cash-flow analysis usually depends on when money was actually received or paid.
Contacts
Contacts represent customers, suppliers and other organisations or individuals associated with transactions.
A contact can appear in both sales and purchasing activity, so it should not automatically be assumed that every contact is only a customer or only a supplier.
Contact data can support:
- Revenue by customer
- Spending by supplier
- Outstanding balances
- Customer concentration
- Payment behaviour
- Contact-level profitability
- Sales frequency
- Customer acquisition and retention analysis
Contacts are normally related to invoices, credit notes, payments and other transaction tables through a stable identifier.
Bank Transactions and Transfers
Bank transactions represent money received or spent directly through bank accounts, including transactions that may not originate from an invoice or bill.
Bank transfers record movements between bank accounts.
These records are important for:
- Cash-in and cash-out analysis
- Bank-account activity
- Direct payments and receipts
- Cash-flow reporting
- Reconciliation analysis
- Transfers between accounts
Transfers must be identified carefully in consolidated cash reporting. A movement between two accounts may appear as both an outgoing and an incoming amount but does not represent new cash entering or leaving the organisation.
Tracking Categories
Tracking categories allow transactions to be analysed by dimensions such as:
- Department
- Region
- Location
- Business unit
- Product line
- Salesperson
Tracking information is often stored at transaction-line level. This means an invoice can contain lines assigned to different tracking options.
A Power BI model must preserve the relationship between the transaction line and its tracking values. Applying a tracking category only at invoice-header level can produce inaccurate results when individual lines have different assignments.
Tracking structures may also differ between Xero organisations, requiring standardisation or mapping before they can be compared.
Budgets
Budget data allows actual financial results to be compared with planned amounts.
Budgets are commonly organised by:
- Account
- Reporting period
- Tracking category, where applicable
- Organisation
Reliable budget-versus-actual reporting requires compatible account mappings, reporting periods and sign conventions.
A monthly budget should also be handled carefully when users want weekly, daily or year-to-date comparisons. The model needs a clear rule for how budget values are allocated or accumulated.
Items
Items represent products or services used on invoices and bills.
They can support reporting such as:
- Revenue by product or service
- Quantity sold
- Average selling price
- Purchase cost
- Product activity
- Customer purchasing patterns
Not every transaction uses an item. Reports should therefore account for invoice lines that contain descriptions and account codes but no item identifier.
Currencies
A Xero organisation has a base currency, while individual transactions may use other currencies when multicurrency features are available.
Currency reporting may involve:
- Transaction currency
- Organisation base currency
- Exchange rates
- Reporting currency
- Conversion dates
- Realised and unrealised currency effects
When several organisations are combined, their base currencies may differ. Consolidated reporting then requires a defined reporting currency and a consistent conversion method.
Organisation and Tenant Identifiers
Every record should remain associated with the Xero organisation from which it originated.
This is essential when reporting across multiple organisations because invoice numbers, account codes, contact names and other values may be repeated.
A reliable model normally retains an organisation or tenant identifier in its keys and relationships. This prevents records from different organisations being joined together accidentally.
Reports Are Not the Same as Raw Transactions
A report displayed inside Xero is the result of accounting rules, report settings, date selections, account classifications and other calculations.
The underlying data retrieved through an integration may instead consist of separate records such as journals, invoices, payments, accounts and contacts.
This means a Power BI report cannot always reproduce a Xero report simply by adding one numeric column.
The model must also understand:
- Which records should be included
- Which date should be used
- How account types affect signs
- Whether the report is cash or accrual based
- How credit notes and payments are treated
- How opening balances are calculated
- Which statuses should be excluded
- How tracking and currency filters apply
Understanding these relationships is the foundation of reliable Xero reporting in Power BI. Visual design comes later; the first priority is ensuring that every calculation reflects the accounting meaning of the underlying data.
What Xero Dashboards Can You Build in Power BI?
Xero data can support a wide range of Power BI dashboards, from high-level executive summaries to detailed financial and operational analysis. The most useful dashboard depends on the decisions it needs to support, the people using it and whether Xero is the only source of data.
Power BI does not replace the underlying accounting records in Xero. Instead, it allows organisations to organise those records into interactive reporting views, apply consistent calculations and present different levels of detail to different audiences.
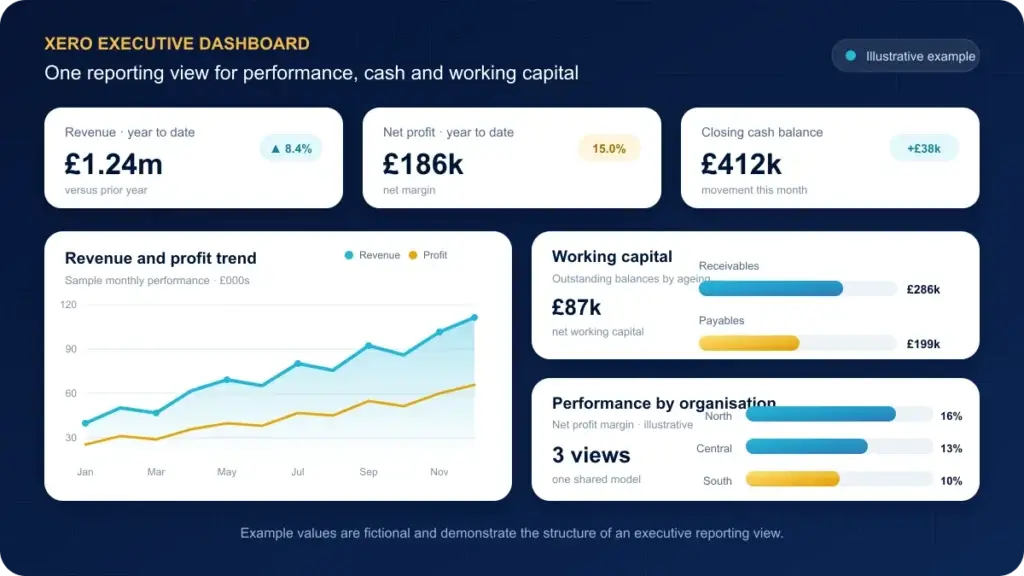
Executive Financial Dashboard
An executive dashboard brings the organisation’s most important financial indicators together in one place. It is designed to answer broad questions quickly, without requiring the reader to work through several separate reports.
Typical measures include:
- Revenue
- Gross profit and gross margin
- Operating expenses
- Net profit
- Cash balance
- Accounts receivable
- Accounts payable
- Budget versus actual performance
Trend charts can show how these measures have changed over time, while filters may allow users to examine a particular organisation, department, region or reporting period.
The purpose of an executive dashboard is not to display every available metric. It should provide a concise view of performance and help decision-makers identify areas that require further investigation.
Profit and Loss Dashboard
A Power BI profit and loss dashboard can present income and expenses using a structure that reflects the organisation’s management reporting requirements.
In addition to a traditional monthly profit and loss statement, it may include:
- Current-period and year-to-date results
- Comparisons with previous periods
- Budget and forecast variances
- Revenue and expense trends
- Gross-margin analysis
- Departmental or regional performance
- Drill-down from account groups to individual transactions
Custom account mappings can be used to create reporting groups that differ from the original Xero chart of accounts. This can be particularly helpful when several organisations use different account codes or naming conventions.
However, any custom presentation should remain reconcilable to the corresponding figures in Xero.
Balance Sheet Dashboard
A balance sheet dashboard helps users examine the organisation’s financial position and how it changes over time.
It may include:
- Assets, liabilities and equity
- Cash and bank balances
- Accounts receivable and accounts payable
- Working capital
- Current ratio and other liquidity measures
- Debt and financing balances
- Month-end balance trends
Power BI can also make it easier to compare balance sheet movements across several periods or organisations. Users can move from a high-level category into individual accounts, provided the reporting model maintains the necessary account and transaction relationships.
Balance sheet reporting requires particular care because values are normally calculated at a point in time rather than summed across a period.
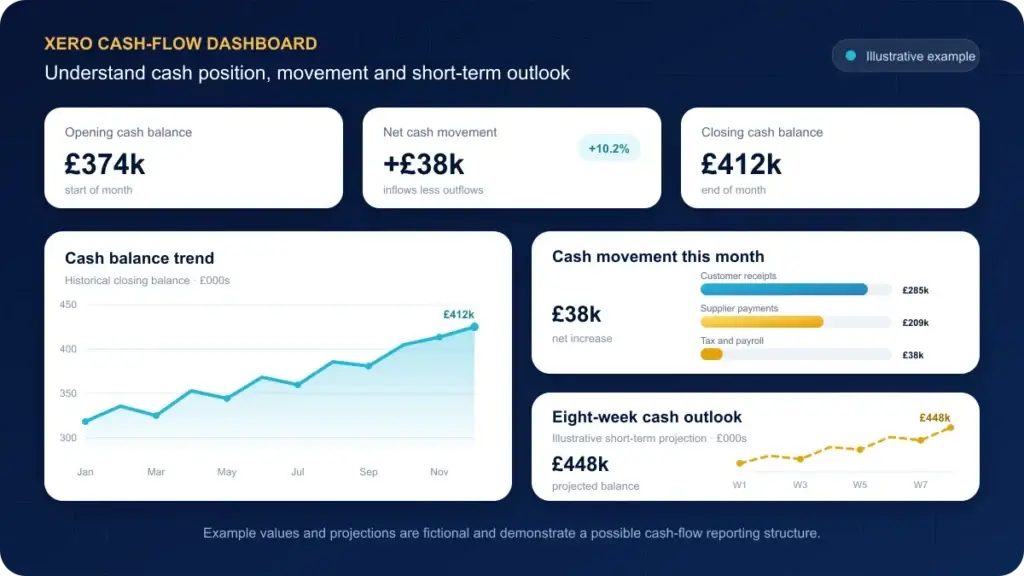
Cash-Flow Dashboard
A cash-flow dashboard focuses on the timing, source and use of cash.
Depending on the available data and reporting model, it may show:
- Opening and closing cash balances
- Cash received from customers
- Payments to suppliers
- Payroll, tax and other major outflows
- Net cash movement
- Cash movements by organisation or bank account
- Historical cash-flow trends
- Short-term cash projections
Cash-flow reporting may be based on bank transactions, payments, journals or a combination of records. The correct approach depends on whether the dashboard is intended to explain historical cash movement, reproduce a formal cash-flow statement or support forecasting.
These are related objectives, but they do not necessarily require the same calculation method.
Accounts Receivable Dashboard
An accounts receivable dashboard helps finance and credit-control teams monitor unpaid customer invoices.
Common views include:
- Total outstanding receivables
- Current and overdue balances
- Ageing buckets
- Overdue invoices by customer
- Average payment times
- Largest outstanding balances
- Receivables trends
- Invoice-level detail
Interactive filters can help users focus on a particular customer, organisation, currency or ageing period. Alerts and conditional formatting can also highlight invoices that require attention.
Reliable receivables reporting must account for invoice status, credit notes, payments, prepayments and overpayments. Simply adding invoice totals without considering these records can produce misleading balances.
For a practical implementation using the Connectorly data model and template, follow our guide to building an aged receivables dashboard in Power BI using Xero data.
Accounts Payable Dashboard
An accounts payable dashboard provides a similar view of the organisation’s obligations to suppliers.
It may include:
- Total outstanding payables
- Bills due within a selected period
- Overdue supplier balances
- Payables ageing
- Upcoming payment requirements
- Largest supplier exposures
- Spending by supplier
- Invoice-level supporting detail
This can help finance teams plan payments, monitor short-term cash requirements and identify overdue liabilities.
As with receivables, the model must correctly handle payments, credit notes and document statuses to remain consistent with Xero.
Revenue and Customer Analysis
Xero invoices and contacts can be used to analyse revenue by customer, product, account, tracking category or period.
A revenue dashboard may show:
- Revenue trends
- Revenue by customer
- Customer concentration
- Average invoice value
- New and returning customers
- Revenue by product or service
- Revenue by region, department or other tracking category
Xero alone may not contain every attribute needed for detailed commercial analysis. For example, customer segments, sales representatives, opportunities and marketing sources may be stored in a CRM system.
Power BI becomes especially useful when this additional information needs to be analysed alongside the accounting results.
Expense and Supplier Analysis
Expense dashboards help users understand where money is being spent and how costs are changing.
Typical analysis includes:
- Expenses by account
- Expenses by supplier
- Monthly cost trends
- Departmental or regional spending
- Recurring supplier costs
- Largest expense movements
- Actual expenditure against budget
Users can begin with a summary and drill through to the transactions responsible for a change.
The usefulness of this analysis depends heavily on the consistency of account coding, contact records and tracking-category usage in Xero. Reporting tools can organise the available data, but they cannot completely correct inconsistent bookkeeping practices.
Tracking-Category Dashboard
Tracking categories can provide an additional reporting dimension for departments, locations, projects or other business units.
In Power BI, tracking data may be used to compare:
- Revenue and profit by department
- Costs by location
- Performance by project
- Budget versus actual results by category
- Trends across tracking options
- Shared costs allocated between business units
This can extend the analysis beyond the layout of the chart of accounts. However, the dashboard should also identify transactions with missing or inconsistent tracking information, because incomplete coding can distort comparisons.
Multi-Organisation Dashboard
When a group operates several Xero organisations, Power BI can provide a common reporting view across them.
A multi-organisation dashboard may include:
- Group-level revenue and profit
- Results by legal entity
- Organisation-to-organisation comparisons
- Consolidated cash balances
- Combined receivables and payables
- Shared management-reporting categories
- Reporting in a common presentation currency
Combining organisations involves more than appending their transactions. The reporting model must preserve each organisation’s identity and address differences in charts of accounts, tracking structures, currencies and accounting practices.
Formal financial consolidation may also require eliminations, ownership adjustments and other accounting entries that are not produced automatically by combining Xero data.
Budget-Versus-Actual Dashboard
A budget-versus-actual dashboard compares recorded financial results with approved budgets or forecasts.
It can show:
- Monthly and year-to-date variances
- Favourable and unfavourable movements
- Variances by account or reporting group
- Departmental budget performance
- Full-year outlook
- Detailed explanations for significant differences
Budget data may come from Xero, a spreadsheet, a planning system or another database. Power BI can bring these sources together, provided their account, organisation, category and period structures can be mapped consistently.
Designing Dashboards Around Decisions
It is possible to create many dashboards from Xero data, but more dashboards do not automatically produce better reporting.
Each dashboard should have a defined audience and purpose. A finance team may need transaction-level detail and reconciliation controls, while senior management may need a concise view of trends, exceptions and business performance.
The strongest Power BI implementations often use a shared reporting model to support several focused views. This keeps financial definitions consistent while allowing each audience to see the information most relevant to its decisions.
How to Build Reliable Financial Reports from Xero Data
Reliable Xero reporting in Power BI requires more than importing data and creating charts. The reporting model must reflect the organisation’s accounting rules, calculate different types of financial values correctly and remain reconcilable to Xero.
A dashboard can look convincing while containing duplicated transactions, inappropriate date filters, inconsistent account mappings or incorrect signs. The following principles help prevent these problems.
Define the Report Before Building It
Start by defining what the report needs to show and who will use it.
Establish:
- Whether it uses cash or accrual accounting
- Whether values represent activity during a period or a balance at a particular date
- Which organisations and currencies are included
- Which Xero report will be used for validation
- How frequently the data should refresh
A statutory statement, management dashboard and cash forecast may all use Xero data, but they do not necessarily use the same calculations.
Choose the Correct Level of Detail
Xero data exists at several levels. An invoice has a document total, while its lines contain the accounts, descriptions, tax amounts and tracking information behind that total.
The model should use the level of detail required by the analysis:
- Customer ageing normally requires invoice and payment records.
- Financial statements require account-level transaction or journal detail.
- Product analysis may require invoice lines and item information.
- Tracking-category reporting generally requires line-level assignments.
Combining document totals with their underlying lines can duplicate values. Each measure should therefore have a clearly defined source table and level of detail.
Create a Consistent Reporting Structure
The chart of accounts provides the foundation for profit and loss and balance sheet reporting. Management reports often need additional groups such as revenue, cost of sales, payroll, operating expenses, current assets and liabilities.
These reporting groups should be defined centrally rather than recreated inside individual report pages.
This becomes especially important when several Xero organisations are combined. Equivalent accounts may use different codes or names and therefore need to be mapped into a common reporting hierarchy.
The original Xero accounts should remain available for reconciliation and drill-down.
Control Dates and Sign Conventions
A dedicated date table can support financial years, year-to-date calculations, comparisons and rolling periods.
The model may contain invoice dates, due dates, payment dates and journal dates. Each serves a different purpose. Revenue reporting may use an invoice or journal date, while overdue receivables normally depend on the due date.
Sign conventions also need to be defined centrally. Revenue may be stored as a credit but displayed as positive, while expense and liability reporting may require different presentation rules.
It is usually safer to preserve the original accounting amount and apply presentation signs through documented measures.
Distinguish Movements from Balances
Profit and loss reports measure activity during a period. Balance sheets show a position at a particular date.
Revenue and expenses can generally be summed between two dates. Balance sheet values normally require all relevant movements up to the selected reporting date.
Adding monthly closing balances together does not produce a valid balance sheet. Measures should distinguish clearly between:
- Period movements
- Opening balances
- Closing balances
- Year-to-date activity
- Cumulative values
The same distinction is important when building cash-flow reports.
Apply Cash and Accrual Logic Consistently
Cash and accrual reporting recognise financial activity at different times.
Accrual reporting generally recognises income and expenses when they are earned or incurred. Cash reporting focuses on when money is received or paid.
A report should state which basis it uses and apply that basis consistently. Reproducing Xero’s cash-basis results may require more than filtering transactions by payment date, particularly where partial payments, credit notes, prepayments or tax are involved.
Handle Statuses, Credits and Payments
Not every Xero record should contribute to every report. Transactions may be draft, authorised, paid, voided or deleted, depending on the object.
A draft invoice might be useful in an operational workflow report but should not automatically contribute to recognised revenue. Status rules should therefore be defined centrally and documented.
Receivables and payables also need to account for:
- Partial payments
- Credit notes
- Prepayments and overpayments
- Payment allocations
- Voided documents
- Currency differences
An invoice’s original total does not necessarily equal its current outstanding balance.
Preserve Organisation and Tracking Context
When several Xero organisations are combined, identifiers must retain their organisation context.
Account codes, contact names and invoice numbers may appear in more than one organisation. Relationships should use stable identifiers so transactions from one organisation cannot connect accidentally to records from another.
Tracking categories also require careful handling. Missing assignments, renamed options and inconsistent structures can distort departmental or location reporting.
A data-quality view showing transactions without required tracking information can help finance teams correct the underlying records.
Treat Currency Conversion Separately
Multi-currency reporting requires a defined conversion method.
A group may need to report transactions in their original currency, each organisation’s base currency or a common presentation currency. Profit and loss values may use average rates, while balance sheet accounts may require closing rates.
Applying one current exchange rate to every transaction rarely provides reliable historical reporting. Currency rules and source rates should therefore be documented separately from the basic financial calculations.
Keep Power BI Relationships Clear
Poorly designed relationships can produce duplicated or missing values.
Where possible, reference tables—such as accounts, contacts, organisations and dates—should filter transaction tables through clear, controlled relationships.
Many-to-many relationships and bidirectional filtering should only be used when their behaviour is understood. Multiple filter paths can cause one selection to reach a transaction table in several ways and produce unexpected totals.
Reconcile Reports to Xero
Reconciliation should happen throughout development.
Begin with a controlled scope:
- One organisation
- One reporting period
- One accounting basis
- One currency
- A small number of accounts
Compare the Power BI result with the corresponding report or balance in Xero. Investigate differences at account and transaction level before expanding the model.
Important checks include:
- Profit and loss values agree by account and period.
- Balance sheet values agree at the selected date.
- Receivables and payables agree with their ageing reports.
- Cash balances agree with the relevant Xero accounts.
- Organisation-level totals remain correct after datasets are combined.
Even a small unexplained difference should be investigated.
If a total still differs, use our practical guide to why Power BI numbers don’t match Xero to check refresh timing, accounting basis, dates, statuses, currencies, relationships and DAX logic.
Document and Maintain Financial Logic
Important measures should explain their source, date basis, included statuses, sign convention, currency treatment and accounting basis.
Reporting controls should also cover scheduled refreshes, changes to account mappings and testing before updated calculations are published.
A report is not reliable simply because it reconciled when it was first created. It must continue producing correct results as transactions, organisations and reporting requirements change.
The best starting point is a small report that reconciles completely. Once the underlying model is trusted, it can be expanded to support additional organisations, budgets, forecasts and operational data.
Reporting Across Multiple Xero Organisations
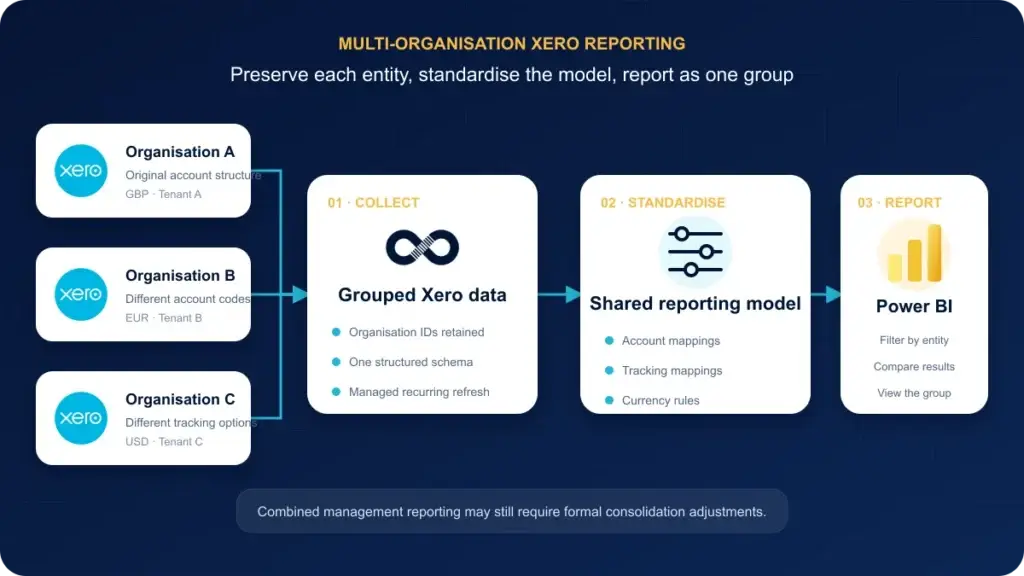
Power BI can combine data from several Xero organisations into one reporting model. This allows a group to view its overall performance while retaining the ability to filter and compare individual entities.
However, reliable multi-organisation reporting requires more than appending several datasets.
Preserve Each Organisation’s Identity
Every transaction, account, contact and tracking record should retain a stable organisation or tenant identifier.
This is important because visible values such as account codes, invoice numbers and contact names may appear in more than one Xero organisation. Using these values alone can create incorrect relationships between entities.
Keeping the organisation context also allows users to move between:
- Individual organisation reports
- Side-by-side comparisons
- Regional or business-unit views
- Combined group reporting
Each organisation should reconcile independently before group-level figures are accepted.
Standardise the Chart of Accounts
Different Xero organisations frequently use different account codes or names for the same financial concept.
For example, software costs may be recorded under “IT Expenses” in one organisation and “Software Subscriptions” in another. If the datasets are simply combined, Power BI will treat these as separate categories.
A shared reporting hierarchy can map the original Xero accounts into consistent group-level categories. The source account should remain available for reconciliation, while the mapped category supports consolidated reporting.
The same principle applies to tracking categories, departments, locations and other reporting dimensions.
Address Currency and Consolidation Requirements
If organisations use different base currencies, the group must define how results will be translated into a common reporting currency.
Profit and loss accounts may use monthly average rates, while balance sheet accounts may require closing rates. Historical equity and intercompany balances may need additional treatment.
It is also important to distinguish combined reporting from formal financial consolidation.
Appending several organisations can produce a useful group-management view, but statutory consolidation may also require:
- Intercompany eliminations
- Ownership adjustments
- Minority interests
- Consolidation journals
- Consistent accounting policies
These requirements should be defined with the organisation’s finance or accounting advisers.
Create One Shared Reporting Model
Once organisation identifiers, account mappings and currency rules are established, a shared Power BI model can support:
- Group profit and loss reporting
- Combined balance sheets
- Cash analysis across bank accounts
- Consolidated receivables and payables
- Entity comparisons
- Departmental and regional reporting
- Group-level management dashboards
Connectorly can group data from several Xero organisations into a structured reporting environment while preserving the organisation associated with each record.
Power BI can then use a common set of relationships, measures and report pages instead of maintaining a separate reporting model for every entity.
The key to successful multi-organisation reporting is standardisation. Combining data is relatively straightforward; ensuring that accounts, currencies and reporting definitions mean the same thing across every organisation is the more important task.
Should You Use a Xero Power BI Template?
A Power BI template can reduce the time required to begin reporting on Xero data. Instead of building every table relationship, calculation and report page from an empty file, users can start from a working reporting structure and customise it for their organisation.
Templates are particularly useful for teams that are new to Power BI or need to demonstrate results quickly.
What Can a Xero Reporting Template Include?
Depending on its purpose, a template may provide:
- Preconfigured connections to the reporting dataset
- Relationships between Xero tables
- A financial date structure
- Reusable Power BI measures
- Report-page layouts
- Filters and drill-through pages
- Financial and operational visualisations
Connectorly provides customisable templates for reporting areas including profit and loss, balance sheet, cash-flow forecasting, bank balances, budget comparisons, revenue, aged debtors and creditors.
There is also an empty starting template for users who want to build their own reports on top of the Connectorly data model.
Templates Are a Starting Point
A template should not be treated as a finished reporting solution without validation.
Each organisation may have different:
- Financial years
- Charts of accounts
- Reporting hierarchies
- Sign conventions
- Tracking categories
- Budget structures
- Currency requirements
- Definitions of management KPIs
The template’s calculations should be reviewed against these requirements and reconciled to Xero before the report is distributed.
Users should also remove pages and measures they do not need. A smaller report tailored to a defined audience is generally easier to understand and maintain than one containing every available dashboard.
When Is Custom Development Still Required?
Custom Power BI development may still be necessary when the organisation needs:
- Reporting across several business systems
- Formal consolidation adjustments
- Complex currency conversion
- Bespoke management-reporting structures
- Industry-specific calculations
- Advanced security requirements
- Forecasting models using external assumptions
- Highly tailored report design
In these situations, a template can still provide a useful data-model foundation, even if the final dashboard looks very different.
The main benefit of a template is not that every reporting decision has already been made. It is that users can begin with a structured model and working examples instead of starting from a blank Power BI file.
A Practical Xero-to-Power BI Implementation Roadmap
A successful Xero Power BI project should begin with a small, clearly defined reporting requirement. The following sequence reduces modelling risk and makes reconciliation easier.
1. Define the Reporting Objective
Identify the first report, its audience and the decisions it should support.
For example, the initial objective might be to create:
- A monthly management profit and loss report
- A cash-flow dashboard
- An accounts receivable dashboard
- A consolidated view of several Xero organisations
Avoid beginning with a long list of unrelated dashboards. One trusted report provides a stronger foundation for later development.
2. Review the Xero Setup
Before connecting the data, review:
- The chart of accounts
- Transaction coding
- Tracking-category usage
- Contact records
- Organisation currencies
- The reporting calendar
- Available budgets
Inconsistent source data will also appear in Power BI. Correcting important accounting and coding problems in Xero is usually better than hiding them in the reporting layer.
3. Choose a Connection Method
Decide whether the project will use manual exports, a custom API integration or a managed connector.
The appropriate choice depends on refresh frequency, technical resources, number of organisations and the importance of automation.
Manual exports may be sufficient for an occasional report. Recurring business reporting normally benefits from a repeatable connection and refresh process.
4. Start with a Structured Model or Template
Create the required relationships between organisations, accounts, contacts, dates and transaction tables.
A prebuilt Connectorly template can provide a working model and example measures. It can then be simplified or customised for the project.
Even when using a template, confirm that its financial calendar, account groupings and calculations match the organisation’s requirements.
5. Build and Validate One Report
Begin with a single organisation and reporting period.
Compare the Power BI result with the corresponding Xero report. Reconcile differences by account and transaction before adding more periods, organisations or calculations.
Document the rules used for dates, statuses, signs, currency and accounting basis.
6. Add Interactivity Carefully
Once the core figures reconcile, add:
- Date and organisation filters
- Tracking-category filters
- Drill-through pages
- Transaction-level supporting detail
- Budget or prior-period comparisons
Every filter should be tested to confirm that it preserves the expected financial totals.
7. Configure Refresh and Distribution
Determine how frequently the underlying data and Power BI model need to refresh.
Before sharing the report, review:
- Power BI workspace access
- Viewer licensing
- Data permissions
- Refresh schedules
- Failure notifications
- Ownership of the dataset and measures
Financial reports should only be distributed to people who are authorised to view the underlying information.
8. Expand the Reporting Model
After the first report is trusted, the same model can be extended with:
- Additional Xero organisations
- Budgets and forecasts
- CRM information
- Project or operational data
- Additional management dashboards
- Role-specific report views
Expansion should remain controlled. New data sources and calculations should be validated without weakening the reliability of the reports already in use.
The most effective implementation sequence is therefore simple: define, connect, model, reconcile, publish and improve. Starting with accuracy creates a reporting environment that can grow without losing the confidence of its users.
Frequently Asked Questions About Xero Reporting in Power BI
Can Xero data be connected to Power BI?
Yes. Xero data can reach Power BI through manual exports, a custom API integration or a managed connector such as Connectorly.
The best method depends on how often the report must refresh, the technical resources available and whether the data needs to be prepared in a reusable reporting model.
Does Power BI replace Xero reporting?
No. Xero remains the accounting system and provides the source financial records, accounting workflows and native reports.
Power BI provides an additional modelling and visualisation layer. Many organisations continue using Xero reports for routine accounting while using Power BI for management dashboards, consolidation and cross-system analysis.
Is Xero Analytics enough without Power BI?
For many small businesses, yes. Xero’s reports, Business snapshot and Analytics capabilities may provide everything required for financial monitoring and cash-flow visibility.
Power BI becomes more relevant when an organisation needs multiple data sources, bespoke calculations, multi-organisation reporting or highly customised dashboards.
Why might Power BI figures differ from Xero?
Common causes include:
- Different date filters
- Cash-versus-accrual settings
- Transaction-status rules
- Incorrect sign conventions
- Missing credit notes or payments
- Duplicated records
- Currency treatment
- Balance sheet calculations that exclude historical movements
Differences should be investigated at account and transaction level rather than corrected with unexplained adjustments.
Can Power BI combine several Xero organisations?
Yes. Data from several Xero organisations can be combined in one Power BI model.
Each record should retain its organisation identifier, and differences in account codes, tracking categories and currencies must be addressed. Combined management reporting may also require additional consolidation adjustments.
Can Xero data be combined with CRM or operational data?
Yes. Power BI can analyse Xero financial data alongside information from systems such as HubSpot, Microsoft Dynamics 365, spreadsheets, project platforms and operational databases.
This can support analysis such as sales pipeline versus invoiced revenue, customer activity versus payment performance and operational metrics versus financial results.
Can Xero data be used for cash-flow forecasting?
Yes. Historical Xero transactions, invoice due dates, payment behaviour and bank balances can contribute to a cash-flow forecast.
Forecasts normally require assumptions about future receipts, payments and business activity. These assumptions may come from budgets, spreadsheets, CRM systems or planning tools rather than Xero alone.
What Xero data can be used in Power BI?
Depending on the connection method, available data may include accounts, journals, invoices, invoice lines, credit notes, payments, contacts, bank transactions, tracking categories, budgets, items, currencies and organisation information.
The availability and structure of particular records can depend on API permissions, the connector and the authorised Xero user.
Do I need technical experience to connect Xero to Power BI?
The amount of technical experience required depends on the connection method.
Building directly against the Xero API requires knowledge of authentication, pagination, data transformation and Power BI modelling. A managed connector and prebuilt template can reduce the initial technical work, although users still need to understand their financial reporting requirements and validate the results.
Are Xero Power BI templates available?
Yes. Connectorly provides customisable Xero Power BI templates for financial statements, cash flow, budgets, bank balances, receivables, revenue and other reporting requirements.
Templates can accelerate development, but their calculations and reporting structure should still be reviewed against the organisation’s accounting rules.
How often can Xero Power BI reports refresh?
Refresh frequency depends on the connection method, Connectorly synchronisation schedule, Power BI configuration and applicable licensing.
The refresh schedule should reflect the report’s purpose. Monthly management accounts, daily receivables monitoring and operational dashboards may each require a different update frequency.
How should a Xero Power BI report be validated?
Begin with one organisation and one reporting period. Compare Power BI with the equivalent Xero report at account level, then investigate differences using transaction detail.
Profit and loss, balance sheet, receivables, payables and cash values should each be reconciled using the appropriate accounting basis and reporting date.
Choosing the Right Xero Reporting Approach
There is no single reporting setup that is right for every organisation.
Xero’s native reports, management reports, Business snapshot and Analytics capabilities provide a strong reporting environment for many businesses. If reporting is centred on one organisation, uses standard accounting measures and is primarily required by the finance team, these tools may be sufficient.
Power BI becomes useful when reporting needs to extend beyond that environment.
Typical reasons include:
- Combining several Xero organisations
- Creating bespoke financial calculations
- Analysing longer-term trends
- Building tailored dashboards for different audiences
- Combining Xero with CRM, project or operational data
- Applying consistent definitions across several reports
- Automating recurring management reporting
The most important decision is not which platform has the longest feature list. It is which approach can answer the organisation’s reporting questions accurately, consistently and with an appropriate level of effort.
When Power BI is required, Connectorly provides a managed way to collect Xero data, organise it into a structured reporting model and make it available for analysis. Its templates can provide a starting point, while the underlying model can also support fully customised reports.
Whichever approach is selected, begin with a clearly defined requirement and validate the results against Xero. A small report that users trust is more valuable than a large dashboard environment containing unexplained differences.
Xero should remain the accounting source of truth. Power BI should turn that trusted financial data into reporting views that help people understand performance and make better decisions.