Why businesses struggle with multiple Xero organisations
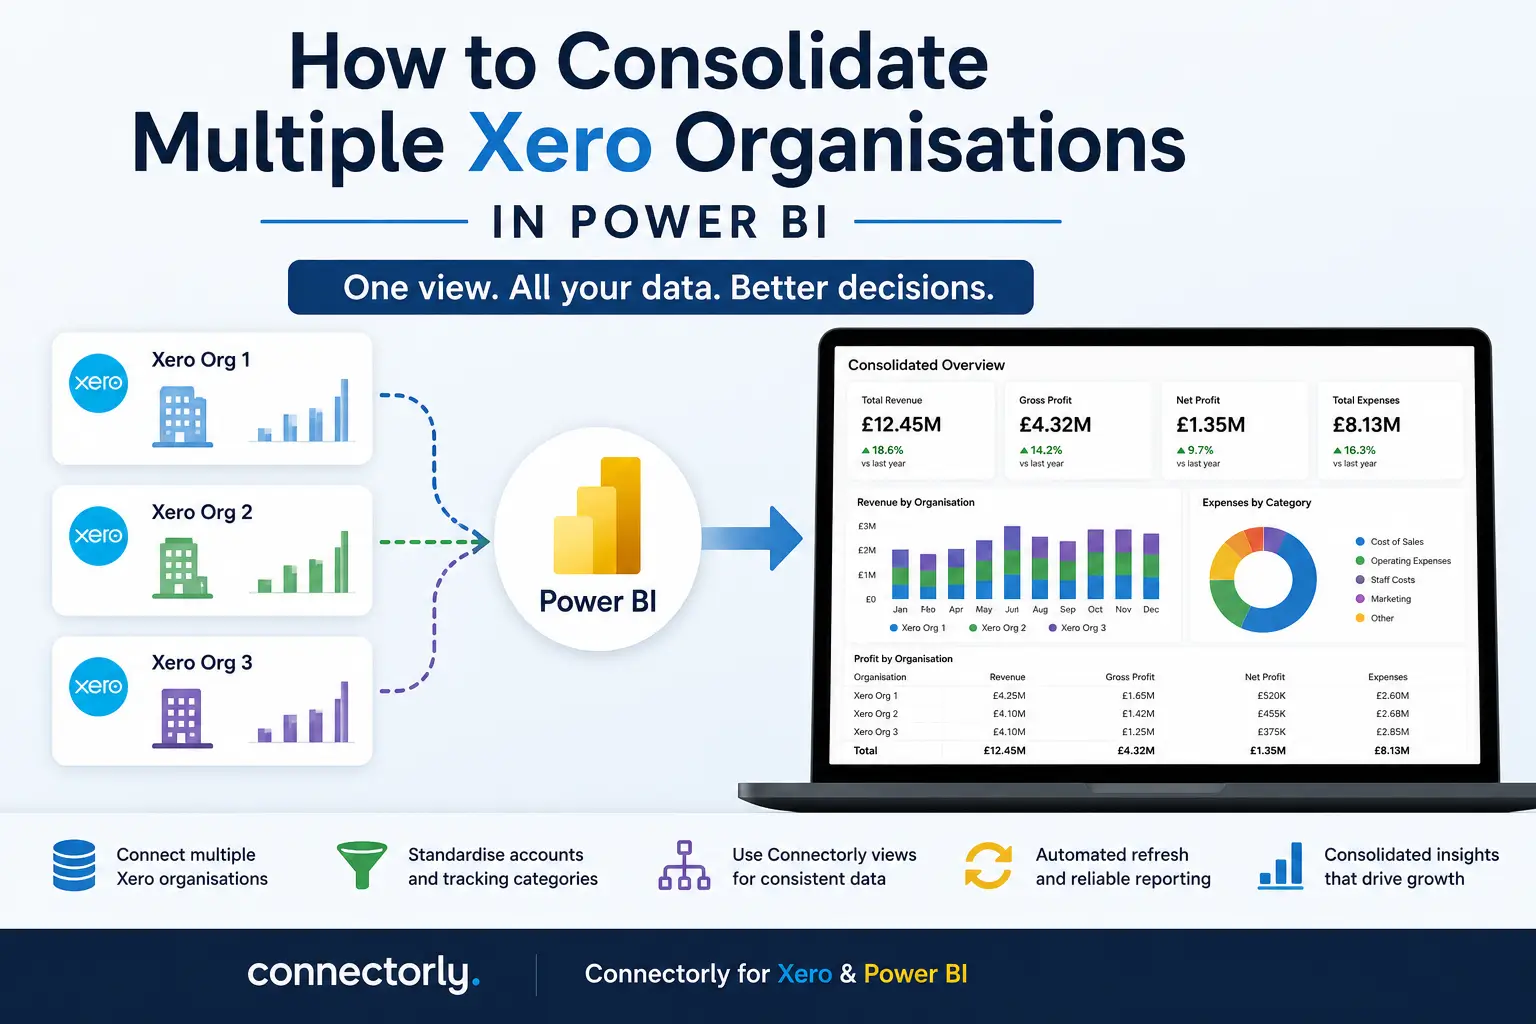
We regularly hear the same challenge from customers managing multiple Xero organisations: “How do we create one consolidated report without exporting everything into spreadsheets?”
This usually happens when businesses operate across multiple entities, regions, brands, or departments. Each organisation has its own Xero file, but leadership still needs a consolidated view of revenue, expenses, profitability, or cash flow.
At first, teams often rely on Excel exports and manual consolidation. Over time, this becomes difficult to maintain. Reports take longer to update, data definitions become inconsistent, and confidence in the numbers starts to decline.
This is why more businesses are moving towards structured reporting in Power BI using tools like Connectorly for Xero & Power BI.
The challenge is not simply connecting multiple Xero organisations. The real challenge is ensuring the data is structured consistently enough to support reliable reporting.
For a complete introduction to connection methods, data structures, consolidation and financial dashboards, see our guide to Xero reporting in Power BI.
Why consolidating multiple Xero organisations is difficult
The biggest issue is inconsistency between organisations.
Even when companies use the same accounting platform, differences often exist in:
- Chart of accounts
- Tracking categories
- Tax settings
- Naming conventions
- Reporting structures
For example, one organisation may use account code 200 for “Sales Revenue”, while another uses 4000. Tracking categories may also differ between entities, making comparisons difficult.
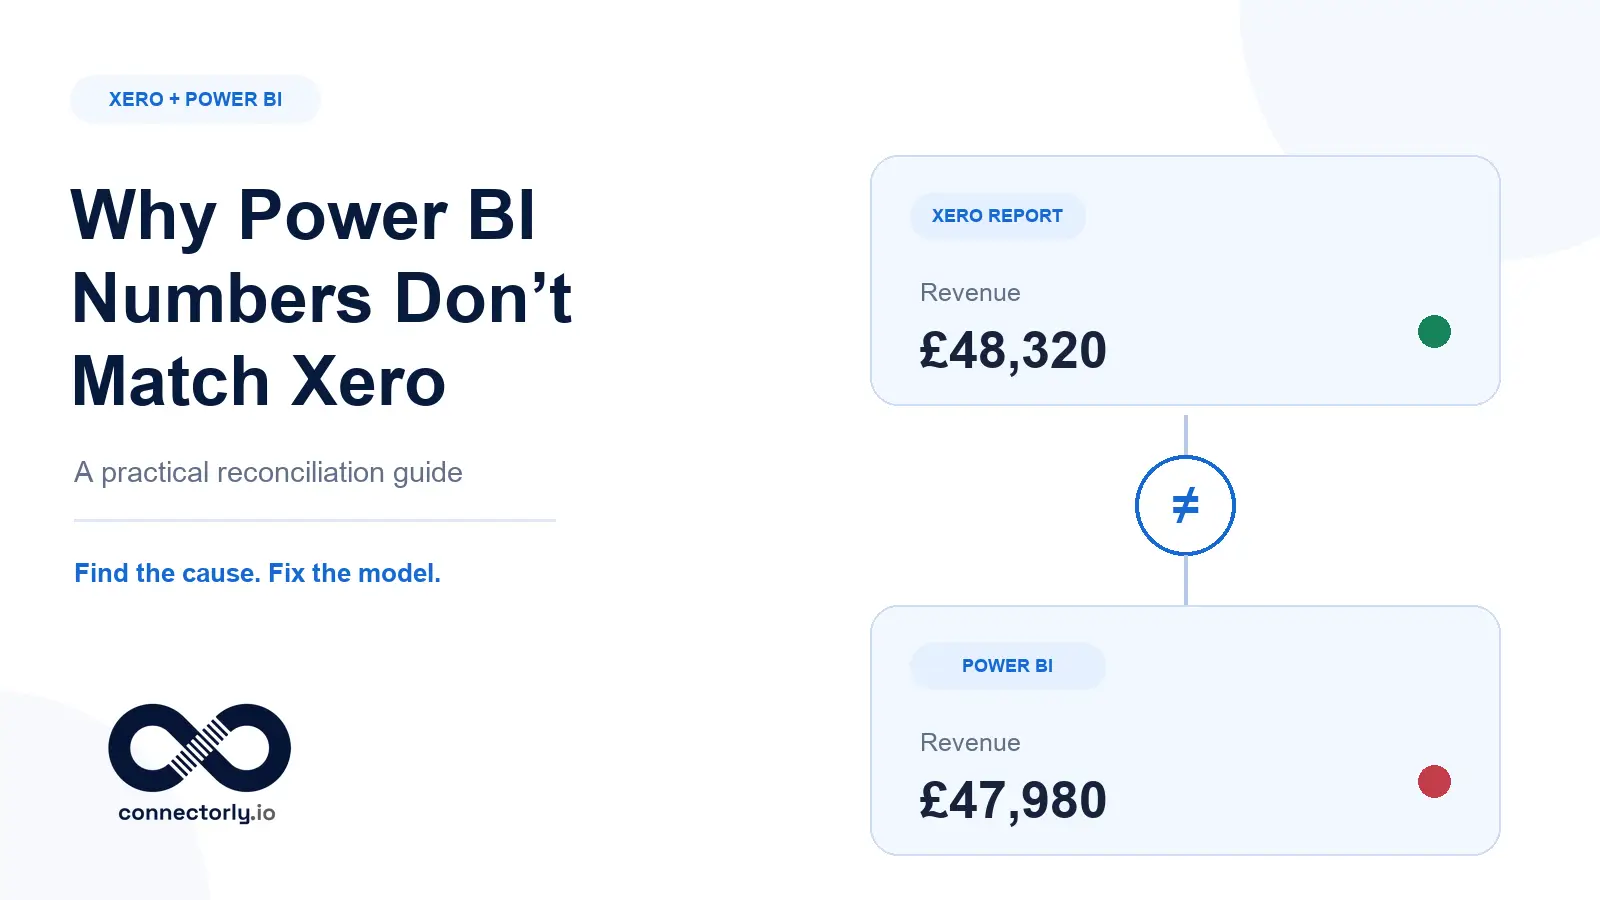
Without standardisation, consolidated reports become unreliable because Power BI cannot automatically determine which accounts or categories should align.
This is one of the main reasons businesses struggle when attempting multi-entity reporting.
Why the chart of accounts matters for consolidated reporting
The chart of accounts is the foundation of financial reporting.
If account structures differ between Xero organisations, Power BI will treat them as separate categories. This creates fragmented visuals and inaccurate totals when attempting to consolidate data.
For example:
- One organisation may classify software subscriptions under “Operating Expenses”
- Another may classify them under “IT Costs”
When these datasets are combined, the same expense appears in multiple categories.
To avoid this, businesses should define a standardised reporting structure before building reports. This does not necessarily mean every Xero organisation must be identical, but there should be a clear mapping between equivalent accounts.
Many businesses create a master reporting structure where multiple account codes from different organisations map into one consolidated reporting category.
This makes Power BI visuals far easier to manage and improves consistency across reports.
Why tracking categories also need standardisation
Tracking categories are another common issue.
Xero tracking categories are often used to separate reporting by:
- Department
- Region
- Business unit
- Product line
However, naming inconsistencies between organisations quickly create reporting problems.
For example:
- One organisation may use “Sales UK”
- Another uses “UK Sales”
Although they represent the same concept, Power BI will treat them as separate values unless they are cleaned or mapped consistently.
Before building consolidated reports, it is important to review:
- Tracking category names
- Tracking option structures
- Missing or duplicated categories
This step significantly reduces complexity later in the reporting process.
How Connectorly simplifies multiple Xero organisation reporting
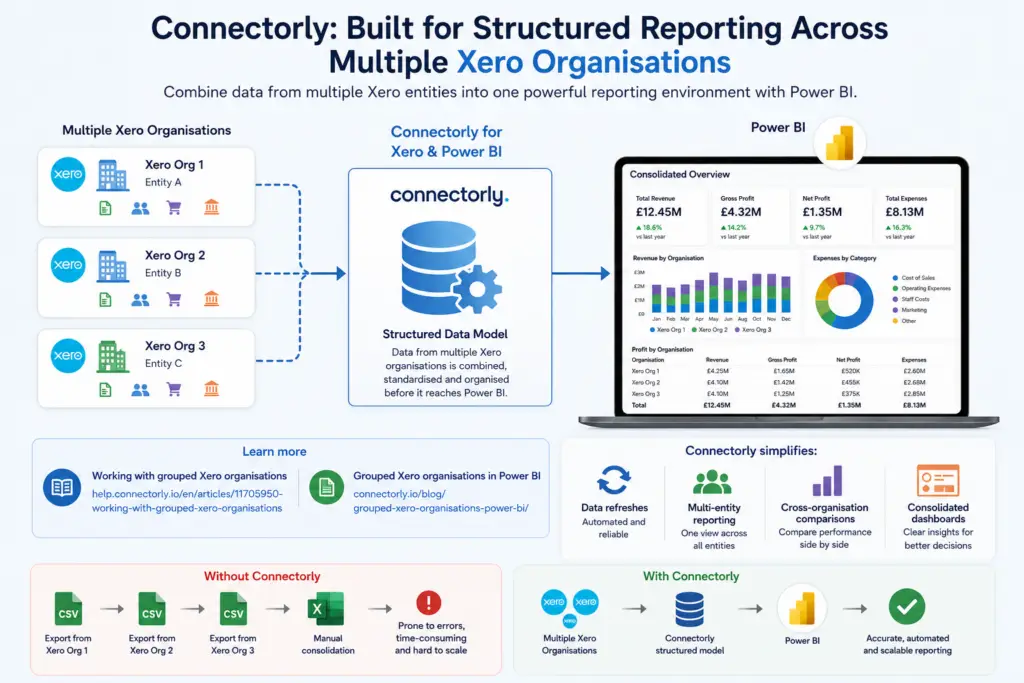
Connectorly is designed specifically to help businesses manage structured reporting across multiple Xero organisations.
Connectorly for Xero & Power BI:
supports grouped Xero organisations, allowing multiple entities to feed into the same reporting environment.
The process is explained further in:
Instead of managing separate datasets manually, Connectorly allows data from multiple organisations to be combined in a structured way before it reaches Power BI.
This simplifies:
- Data refreshes
- Multi-entity reporting
- Cross-organisation comparisons
- Consolidated dashboards
It also reduces the need for repeated CSV exports and spreadsheet-based consolidation.
How Connectorly views help with consolidation
One of the most useful features for consolidated reporting is Connectorly views.
Connectorly Views allow users to create custom groupings across:
- Chart of accounts
- Tracking categories
- Contacts
- Products and services
This gives businesses far more flexibility when building consolidated reports in Power BI.
Instead of relying only on the raw Xero structure, users can define reporting groupings that better reflect how the business wants to analyse data. For example, multiple account codes from different Xero organisations can be grouped into one consolidated reporting category, even if the original account structures are not identical.
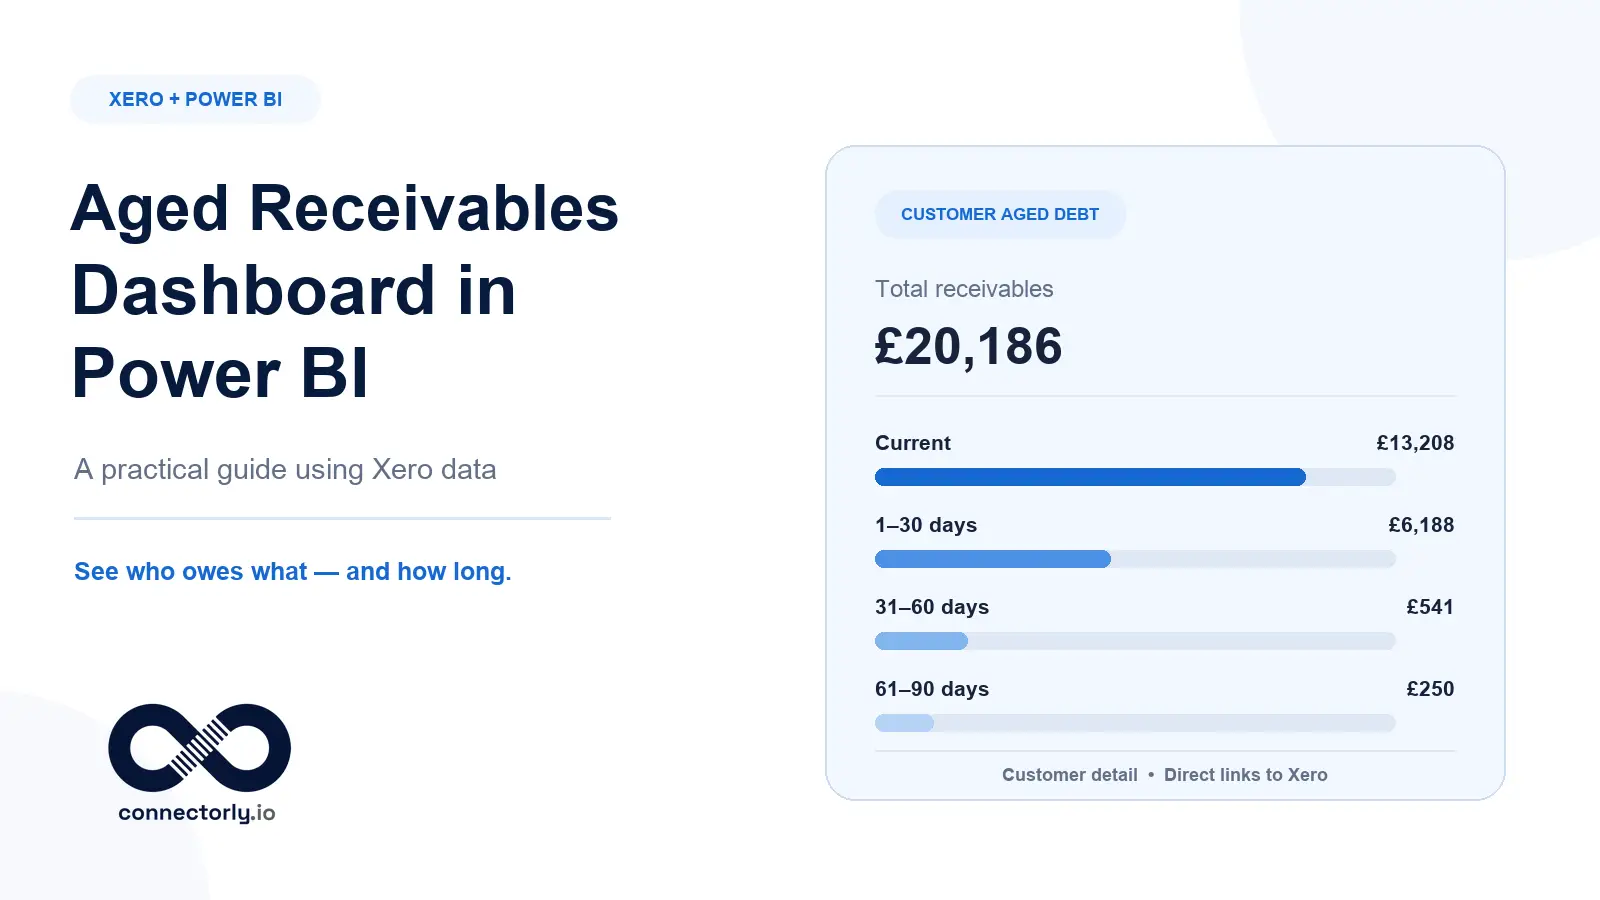
This becomes especially valuable for:
- Flexible balance sheet reporting
- Consolidated profit and loss reporting
- Revenue analysis across entities
- Accounts payable and receivable reporting
- Multi-entity cash flow analysis
Connectorly Views also make it easier to test and simulate different reporting structures without changing the underlying accounting setup inside Xero. For example, finance teams can create alternative grouping structures for management reporting, departmental analysis, or scenario planning directly within the reporting layer.
Because these groupings are prepared outside Power BI (on the Connectorly Portal), report relationships and measures become easier to manage. This reduces the amount of transformation work required inside Power BI itself and helps maintain consistency across reports.
How to build consolidated reports in Power BI

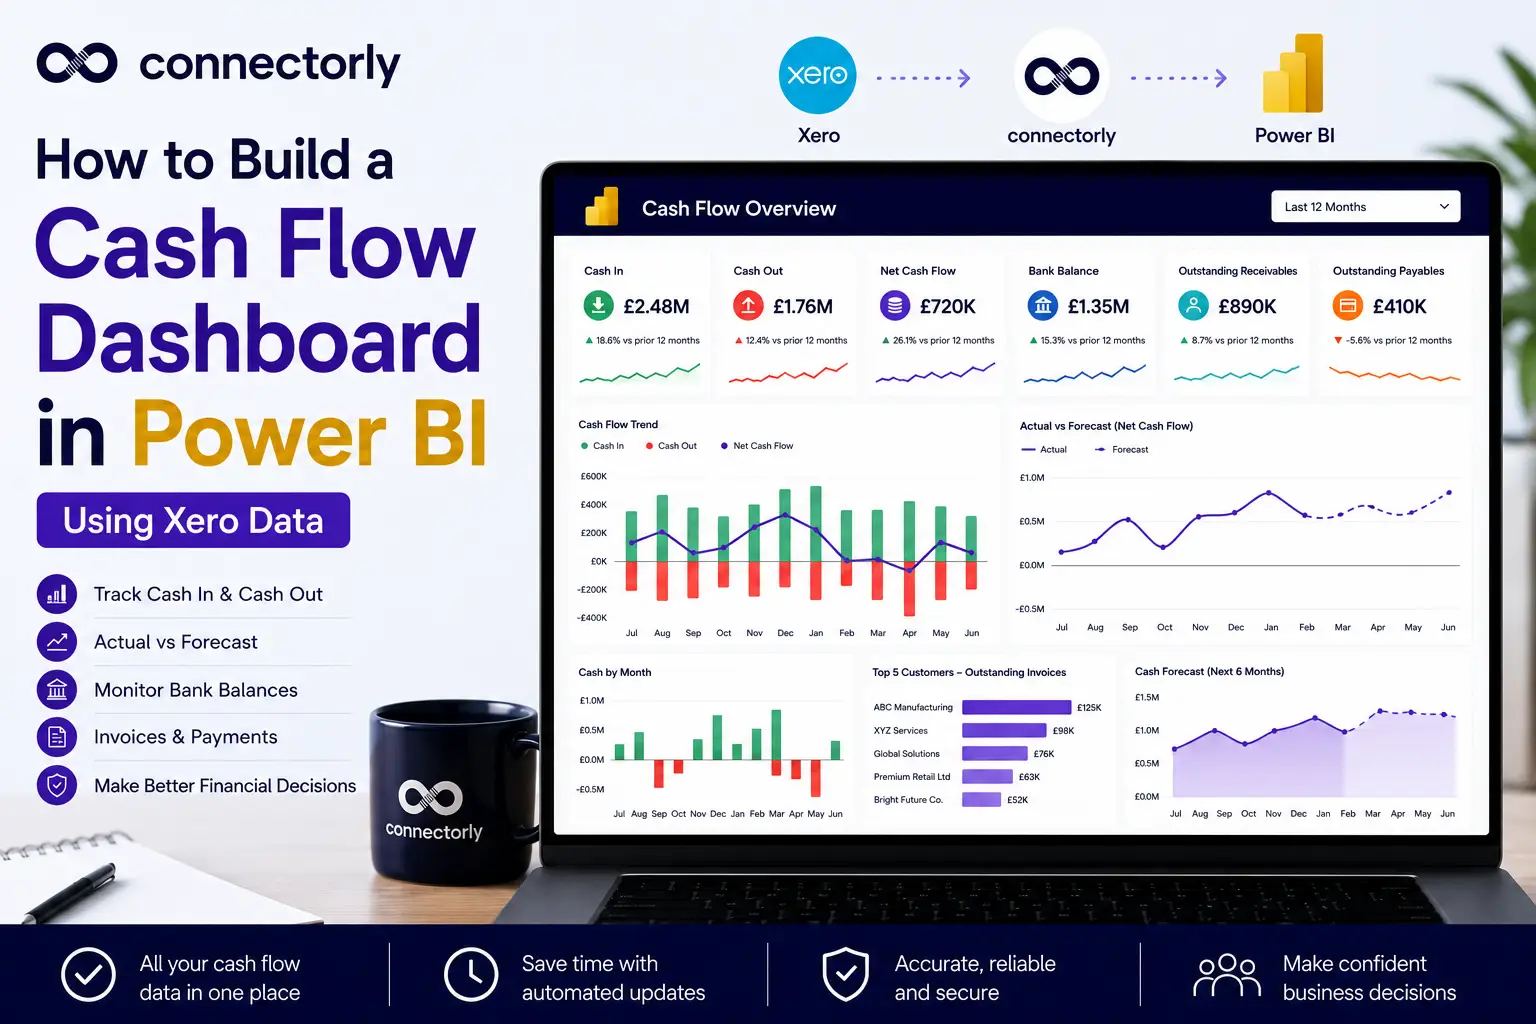
Once data from multiple Xero organisations is available through Connectorly, businesses can start building consolidated reports in Power BI much faster.
If they use the free Connectorly Xero Power BI templates, much of the setup work is already completed. The templates include pre-built relationships between tables, along with a large number of useful pre-created measures for common reporting scenarios such as revenue, expenses, profit calculations, and cash flow analysis.
This significantly reduces the amount of manual modelling required inside Power BI and helps teams get to reporting more quickly.
The templates also include the Xero Account Views table, which contains the Connectorly Views and grouping structures created inside Connectorly. This allows businesses to use their custom account groupings, tracking category structures, and reporting mappings directly inside Power BI without recreating them manually.
For example, businesses can use these views to:
- Build flexible balance sheet and profit & loss reports
- Create consolidated reporting across multiple organisations
- Compare revenue and expenses between entities
- Simulate alternative reporting structures using different groupings
Because the relationships and reporting logic are already prepared, teams can focus more on analysing data and less on maintaining the Power BI model itself.
Filters and slicers can also be added to allow users to switch easily between:
- Individual Xero organisations
- Regional or business unit views
- Fully consolidated reporting
Since the data structure is centralised and standardised, report maintenance becomes far easier over time compared to spreadsheet-based consolidation approaches.
Why spreadsheet consolidation becomes risky over time
Many businesses initially consolidate multiple Xero organisations using Excel.
This usually involves:
- Exporting reports from each organisation
- Copying data into one workbook
- Rebuilding formulas after each refresh
While workable at small scale, this approach creates risks as data volume grows.
Common problems include:
- Incorrect formulas
- Missing records
- Duplicate data
- Version control issues
- Inconsistent account mappings
Automated reporting in Power BI reduces these risks by centralising the data model and refresh process.
Can multiple Xero organisations also be combined with CRM data?
Yes.
Many businesses eventually want to combine finance data with CRM or operational data. Connectorly supports this through additional integrations such as:
This allows businesses to compare:
- Pipeline vs invoiced revenue
- Sales activity vs financial outcomes
- Revenue by customer or business unit
within one reporting environment.
Recommended further reading
To explore related topics further, consider linking to:
- Grouped Xero Organisations in Power BI
- How to Combine Connectorly Data
- Why Excel Is Killing Your Reporting
- Power BI Direct API vs Connectorly for Xero Reporting
These articles provide additional guidance around structured reporting and multi-system data modelling.
Final thoughts
Consolidating multiple Xero organisations is not just about combining data. It is about creating consistency across accounts, tracking categories, and reporting structures.
Without standardisation, consolidated reporting becomes difficult to trust and maintain.
Connectorly simplifies this process by grouping multiple Xero organisations into a structured reporting environment that works cleanly with Power BI. Combined with consistent account mapping and well-defined tracking categories, this creates a far more reliable reporting setup than spreadsheet-based consolidation.
For businesses managing multiple entities, this approach makes consolidated reporting significantly easier to scale.