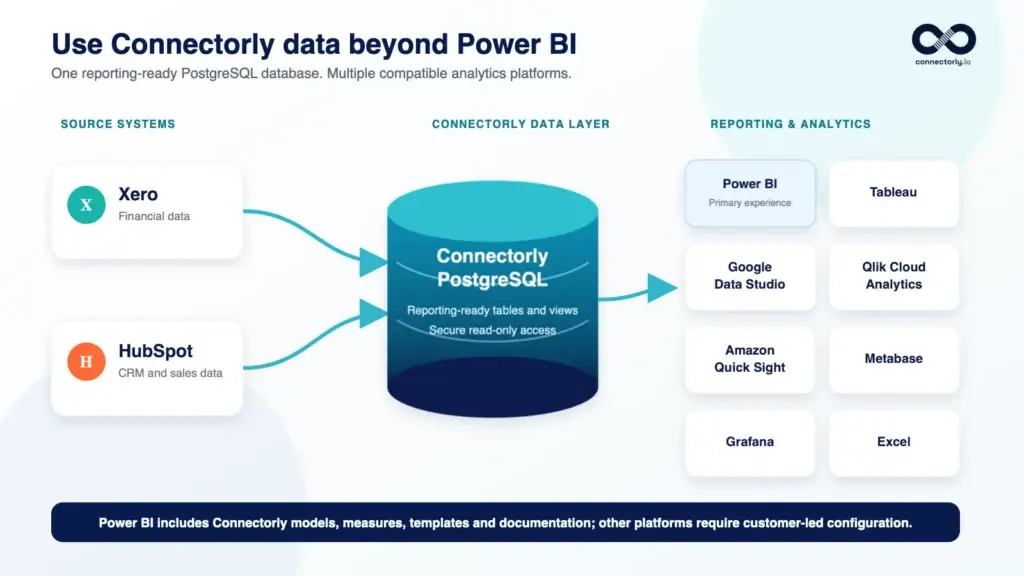
This opens up possibilities for organisations that prefer tools such as Tableau, Google Data Studio, Qlik Cloud Analytics, Qlik Sense, Amazon Quick Sight, Metabase, Grafana or Excel. The available features, connection process and refresh options will depend on the chosen platform.
However, Power BI remains the most complete Connectorly experience. Our Power BI solutions include prebuilt data models, relationships, measures, report templates and detailed documentation designed specifically for Xero and HubSpot reporting. Connectorly does not provide prebuilt reports, platform-specific modelling or guaranteed technical support for every third-party reporting tool. Customers using another platform are responsible for configuring, testing and maintaining that connection and their reports. In this guide, we’ll explain how this flexibility works, which major reporting platforms can connect to PostgreSQL and what you should consider before choosing an alternative to Power BI.How Connectorly Makes Your Data Available for Reporting
Connectorly separates the data integration layer from the reporting layer. Your business data is therefore not locked inside a particular dashboard or visualisation platform.
The process works in four stages:
- Connectorly connects to your source system. Depending on your subscription, this may include Xero, HubSpot or another supported business platform.
- Your data is extracted and updated automatically. Connectorly manages the ongoing synchronisation instead of requiring repeated manual exports.
- The data is organised inside a dedicated PostgreSQL database. Reporting-ready tables, fields and views make the source data easier to analyse.
- Your reporting platform queries the database. You receive dedicated read-only credentials that compatible reporting tools can use to access the available data.
This architecture allows the same Connectorly database to act as a source for different reporting platforms. Changing the visualisation tool does not require you to rebuild the connection to Xero or HubSpot from the beginning.
However, the experience after connecting will differ between platforms. Power BI users can take advantage of Connectorly’s prebuilt models, relationships, measures and templates. With another reporting tool, you may need to create relationships, calculations, queries and dashboards yourself.
Why Power BI Remains the Primary Connectorly Experience
The ability to use another reporting platform does not mean every platform provides the same Connectorly experience.
Connectorly’s solutions are designed primarily around Microsoft Power BI. Power BI customers receive more than access to database tables: they can also use reporting assets that reduce the time and technical knowledge required to create useful reports.
Depending on the Connectorly solution, these resources may include:
- Prebuilt Power BI data models and relationships
- Reporting-ready tables and database views
- Predefined measures and calculation logic
- Customisable Power BI report templates
- Example financial, sales and operational dashboards
- Connectorly-specific setup and troubleshooting documentation
- Guidance created around real Xero and HubSpot reporting scenarios
This allows many customers to begin with a working reporting foundation instead of designing an entire analytical model from an empty report.
When you connect Tableau, Data Studio, Qlik, Amazon Quick Sight, Metabase, Grafana or another compatible tool, the underlying Connectorly data remains available. However, you will normally need to create the platform-specific relationships, calculations, visualisations and report navigation yourself.
For organisations without an existing preference or specialist reporting team, Power BI is therefore usually the most practical place to start. If you are new to the platform, our complete Power BI beginner guide explains the core concepts and report-building process.
Which Reporting Platforms Can Use Connectorly Data?
Several major reporting and analytics platforms support PostgreSQL connections. This makes them potential options for querying a Connectorly database, although compatibility should always be tested with your chosen platform, subscription and network configuration.
| Platform | PostgreSQL connection | Best suited to | Important consideration |
|---|---|---|---|
| Microsoft Power BI | Native PostgreSQL connector | Financial, sales, operational and executive reporting | The primary Connectorly platform, with prebuilt models, measures, templates and documentation |
| Tableau | Dedicated PostgreSQL connector | Interactive visual analytics and enterprise dashboards | A PostgreSQL driver may be required, and you must build the Tableau data model yourself |
| Google Data Studio | Built-in PostgreSQL connector using JDBC | Accessible web-based reports and shareable dashboards | The connector has query, schema and row limits, including a maximum of 150,000 rows per query |
| Qlik Cloud Analytics and Qlik Sense | PostgreSQL connector options are available | Associative analysis and enterprise analytics | Connection availability and configuration depend on the Qlik product and deployment |
| Amazon Quick Sight | PostgreSQL is a supported relational data source | AWS-based analytics, dashboards and embedded reporting | Quick Sight must be able to reach the database over the network and may require access to PostgreSQL metadata tables |
| Metabase | Native PostgreSQL database connection | Self-service analytics and straightforward internal dashboards | You are responsible for hosting, configuration and report development unless using Metabase Cloud |
| Grafana | Built-in PostgreSQL data source | Operational monitoring, time-series analysis and alerting | It is more technically oriented and may be less suitable for traditional financial statements |
| Microsoft Excel | PostgreSQL connection through ODBC | Ad-hoc analysis, pivot tables and existing spreadsheet models | Large datasets can affect performance, and Connectorly does not officially support Excel connections |
Our step-by-step Excel connection guide demonstrates how PostgreSQL credentials can be used outside Power BI. The precise process differs for every reporting platform.
What You Need to Connect Another Reporting Tool
Although the screens and terminology differ between platforms, most PostgreSQL connections require the same core information:
- Hostname: the address of your dedicated Connectorly database
- Port: the connection port shown with your database details
- Database name: the specific PostgreSQL database you are authorised to access
- Username: your dedicated read-only database user
- Password: the password associated with that user
- SSL or TLS settings: the secure connection options required by the reporting platform
Your Connectorly server address may be displayed in a format similar to:
youruniqueid.connectorly.io:443
If the reporting platform provides separate fields for the hostname and port, enter only the hostname in the server field and enter 443 in the port field. Do not include the port twice.
Some desktop applications also require a PostgreSQL, ODBC or JDBC driver. Cloud-based reporting platforms may instead require the Connectorly database to be reachable from their published IP addresses. They may also impose their own restrictions on PostgreSQL versions, schemas, query duration or returned row counts.
Never publish database credentials inside a report, screenshot, shared document or public code repository. If several people need access, manage the reporting platform’s sharing and permissions rather than distributing the database password unnecessarily.
The General Connection Process
The exact menu names vary, but connecting a reporting platform to Connectorly normally follows these steps:
- Open the platform’s data connection area. Look for an option such as Add data source, New connection, Connect to data or Get data.
- Select PostgreSQL. If PostgreSQL is not listed directly, check whether the platform supports it through ODBC or JDBC.
- Enter your Connectorly database details. Provide the hostname, port, database name, username and password exactly as supplied.
- Configure the secure connection. Enable the appropriate SSL or TLS option if the platform asks for it.
- Test the connection. Confirm that the platform can reach the database and authenticate the read-only user.
- Select a small reporting table or view first. Validate the field names, dates and values before importing a large dataset or building the complete report.
Once connected, review how the platform handles relationships, joins, refreshes, calculated fields and data types. These features can behave differently from Power BI, even when the tools query the same PostgreSQL tables.
Start with a limited report and a small selection of fields. This makes it easier to identify connection, performance or modelling issues before investing time in a complete dashboard.
Using Connectorly Data with Tableau
Tableau provides a dedicated PostgreSQL connector for Tableau Desktop, Tableau Cloud, Tableau Server and Tableau Prep. This makes Tableau one of the most established Power BI alternatives for organisations that already use the Tableau ecosystem.
To begin in Tableau Desktop, open the Connect area and select PostgreSQL. Enter the Connectorly server address, database name, username and password, then configure SSL if requested. Tableau may prompt you to install a PostgreSQL driver before it can create the connection.
After connecting, you can select Connectorly tables and views, define relationships or joins, and create Tableau calculations and dashboards. You can also use custom SQL when you need to limit the imported fields or prepare a specific reporting dataset.
Tableau may be a good choice when your organisation:
- Already has Tableau licences and experienced report developers
- Uses Tableau as its standard enterprise analytics platform
- Wants to combine Connectorly data with existing Tableau data sources
- Needs highly interactive dashboards and visual exploration
Connectorly does not currently provide prebuilt Tableau workbooks or Tableau-specific data models. Your team will need to configure the model, calculations, refreshes and dashboards. Refer to Tableau’s current PostgreSQL connection documentation for the platform-specific setup requirements.
Using Connectorly Data with Google Data Studio
Google Data Studio—called Looker Studio between 2022 and April 2026—is a browser-based reporting platform for creating and sharing interactive dashboards.
Data Studio includes a PostgreSQL connector that uses JDBC. To create a connection, select the PostgreSQL connector and enter the Connectorly hostname, port, database name, username and password. Data Studio also supports TLS 1.2 for encrypted database connections.
However, its PostgreSQL connector has several important limitations:
- Google currently documents testing against PostgreSQL versions 9.6 to 14
- A standard connection accesses one database table at a time
- Tables outside the
publicschema require a custom query - Each query can return a maximum of 150,000 rows before the results are truncated
- Queries may time out after approximately three to five minutes
- Some PostgreSQL data types are not supported
Because Connectorly data may be organised into named schemas such as xero or hubspot, you may need to use Data Studio’s custom query option rather than selecting a table directly.
Data Studio may work well for smaller, focused dashboards that need easy browser-based sharing. However, its query and modelling limitations make it less suitable than Power BI for large transaction datasets, complex financial statements or advanced multi-table reporting.
Connectorly does not currently provide Data Studio templates or platform-specific support. Before committing to this approach, test the connection, required schema, dataset size and refresh behaviour. See Google’s current PostgreSQL connector documentation for the latest requirements and limits.
Using Connectorly Data with Qlik
Qlik currently offers cloud analytics through Qlik Cloud Analytics, while Qlik Sense remains available for client-managed and desktop deployments.
Qlik’s PostgreSQL connector is available across supported Qlik Sense offerings. A connection can be created through the Add data interface or the Data load editor by entering the Connectorly hostname, port, database name, username and password.
Current Qlik documentation lists support for PostgreSQL versions 12 to 18. The connector also supports SSL configuration and a broad range of PostgreSQL data types.
Qlik may be appropriate when your organisation:
- Already uses Qlik Cloud Analytics or Qlik Sense
- Has developers familiar with Qlik’s associative data model
- Wants to combine Connectorly data with existing Qlik applications
- Needs enterprise analytics across multiple business systems
After loading the Connectorly tables, your Qlik developer will need to create the application’s data model, loading scripts, calculations, visualisations and refresh process. Connectorly does not currently provide prebuilt Qlik applications or Qlik-specific technical support.
Because Qlik products can be deployed in different ways, verify the connection and networking requirements for your particular Qlik environment. See Qlik’s current PostgreSQL connection documentation for the available settings.
Using Connectorly Data with Amazon Quick Sight
Amazon QuickSight evolved into Amazon Quick in October 2025. Its business intelligence and dashboard functionality is now called Amazon Quick Sight within the wider Amazon Quick platform.
Amazon Quick Sight supports PostgreSQL as a relational data source. Authors can create a new dataset, select PostgreSQL and provide the Connectorly server, port, database name and read-only credentials.
This option may be suitable for organisations that already use AWS and want to:
- Create cloud-based dashboards and analyses
- Use Quick Sight’s SPICE in-memory analytics engine
- Embed analytics within applications
- Combine Connectorly data with other supported AWS data sources
Network access is an important consideration. Amazon Quick Sight must be able to reach the Connectorly database from the selected AWS Region. Its current documentation also states that PostgreSQL connections require SELECT access to certain metadata objects, including pg_stats, pg_class and pg_namespace.
These requirements mean that compatibility should be tested before building reports. The standard Connectorly read-only user may not automatically satisfy every platform-specific metadata or networking requirement.
Connectorly does not currently provide Quick Sight datasets, calculations, dashboards or platform-specific technical support. See Amazon Quick’s current supported data-source documentation for the latest PostgreSQL requirements.
Using Connectorly Data with Metabase
Metabase is a business intelligence platform designed to make database reporting accessible to both technical and non-technical users. It is available as a hosted cloud service or as a self-hosted application.
Metabase supports PostgreSQL as a data warehouse connection. An administrator can add the Connectorly database by entering its hostname, port, database name, username and password. Metabase attempts to use an SSL connection by default when the database supports it.
Once connected, Metabase can synchronise the available database schema and expose permitted tables and fields through its query builder. More technical users can also create SQL queries, models and reusable metrics.
Metabase may be a suitable option when your organisation:
- Wants relatively straightforward internal dashboards
- Prefers a lower-code interface for database reporting
- Has the technical resources to manage a self-hosted analytics platform
- Already uses Metabase for other operational databases
Schema synchronisation and field scanning can create additional database queries, so these settings should be reviewed carefully. The Connectorly user must remain read-only, and features that require write access should not be enabled against the Connectorly database.
Connectorly does not provide Metabase models, questions, dashboards or platform-specific support. See Metabase’s current PostgreSQL connection documentation for setup and SSL options.
Using Connectorly Data with Grafana
Grafana is primarily known for operational monitoring, time-series dashboards and alerting. However, it also includes a built-in PostgreSQL data source, so no additional Grafana plugin is required to query a compatible PostgreSQL database.
A Grafana administrator can add the Connectorly database through Connections → Add new connection → PostgreSQL. The configuration requires the Connectorly hostname and port, database name, read-only username, password and the appropriate TLS or SSL mode.
Grafana may be useful when your organisation wants to:
- Monitor sales or operational activity over time
- Create frequently updated KPI panels
- Configure alerts based on database query results
- Combine business data with existing technical or operational monitoring
Grafana’s PostgreSQL query editor supports SQL queries, time filters, template variables and table visualisations. This gives technical teams considerable flexibility, but report developers will normally need SQL knowledge to shape Connectorly data for each dashboard.
Grafana is generally less suitable for traditional profit and loss statements, balance sheets or highly formatted management reports. Power BI remains the stronger Connectorly option for those scenarios.
Connectorly does not provide Grafana dashboards, queries, alerts or platform-specific support. Grafana also recommends using a PostgreSQL user with only SELECT permissions, which aligns with Connectorly’s read-only access model. See Grafana’s current PostgreSQL configuration documentation for the latest settings.
Using Connectorly Data with Microsoft Excel
Excel can connect to a Connectorly PostgreSQL database through an ODBC connection. This allows finance and sales teams to refresh Xero or HubSpot data without repeatedly downloading and replacing CSV files.
Excel may be useful when you:
- Already have established spreadsheet models or pivot tables
- Need quick ad-hoc analysis
- Want to combine Connectorly data with locally maintained assumptions or forecasts
- Are working with a limited and carefully filtered dataset
However, Excel is not a database engine and can struggle with large transaction volumes. Performance may decline when workbooks import extensive historical data, wide tables or large HubSpot activity datasets. Excel worksheets also have a maximum of 1,048,576 rows.
Connectorly does not officially support Excel connections or provide prebuilt Excel reporting models. Customers are responsible for installing the appropriate PostgreSQL ODBC driver, configuring the connection and keeping imported datasets manageable.
For complete instructions, see our step-by-step guide to connecting Xero or HubSpot data to Excel using Connectorly.
What Connectorly Supports—and What It Does Not
Connectorly’s responsibility is to extract supported source data, organise it within the Connectorly data model and make it available through the customer’s dedicated PostgreSQL database.
For Power BI, Connectorly also provides the most complete reporting experience, including prebuilt models, relationships, measures, templates and detailed guidance.
Important support information
Access to the Connectorly PostgreSQL database does not mean that Connectorly officially supports every reporting platform capable of connecting to PostgreSQL.
Unless otherwise agreed, customers are responsible for installing third-party drivers, configuring network access, creating database connections, writing queries, building platform-specific data models, creating calculations, designing dashboards and maintaining refresh schedules outside Power BI.
Connectorly can help confirm the database details and whether the customer’s dedicated read-only credentials are operating as expected. However, we cannot guarantee compatibility with every version, subscription level, deployment method or feature of a third-party reporting platform.
Third-party products also change over time. A platform may introduce new connection requirements, alter its supported PostgreSQL versions or impose new query and networking restrictions. Always review the platform provider’s current documentation and test the intended reporting scenario before relying on it in production.
How to Choose the Right Reporting Platform
The best reporting tool is not necessarily the platform with the longest feature list. It is the one that fits your organisation’s existing skills, reporting requirements, infrastructure and support expectations.
Consider the following questions:
- Does your organisation already standardise on a BI platform? Reusing Tableau, Qlik or another established platform may be more practical than introducing a new tool.
- Do you have experienced report developers? Non-Power BI options normally require your team to build the analytical model, calculations and dashboards.
- How complex are your reports? Financial statements, consolidation and multi-table CRM analysis need stronger modelling capabilities than a small operational dashboard.
- How much data will you query? Row limits, query timeouts and import performance can make some platforms unsuitable for large transaction datasets.
- How will reports refresh? Check whether the platform supports scheduled database refreshes and whether a gateway, cloud agent or network configuration is required.
- What level of support do you need? Connectorly’s templates and detailed reporting guidance are primarily designed for Power BI.
If your organisation already has the technical skills and infrastructure for another PostgreSQL-compatible reporting platform, using it with Connectorly may be a sensible option.
If you want the fastest path from connected Xero or HubSpot data to working reports, Power BI remains the recommended choice because the Connectorly reporting assets are already designed around it.
Final Thoughts
Connectorly is more than a visual connection between Xero or HubSpot and a single reporting application. It provides structured business data through a dedicated PostgreSQL database, allowing organisations to choose a compatible reporting platform that fits their existing technology and skills.
Tableau, Data Studio, Qlik, Amazon Quick Sight, Metabase, Grafana and Excel may all be possible options. However, each platform has its own drivers, security settings, modelling approach, refresh process and technical limitations.
Power BI remains the most complete and fully documented Connectorly experience. It gives customers access to prebuilt reporting models, relationships, measures and templates that are not currently provided for other platforms.
If you decide to use another reporting tool, begin with a small proof of concept. Confirm database connectivity, validate the required tables and views, test performance and make sure your team can maintain the resulting reports before moving them into production.
Frequently Asked Questions
Can I use Connectorly without Power BI?
Yes. Connectorly makes supported Xero or HubSpot data available through a dedicated PostgreSQL database. A compatible reporting platform may be able to query that database using your read-only credentials.
Which reporting tools can connect to Connectorly?
Potential options include Tableau, Google Data Studio, Qlik Cloud Analytics, Qlik Sense, Amazon Quick Sight, Metabase, Grafana and Excel. Compatibility depends on the platform’s PostgreSQL connector, networking, security settings and technical limits.
Does Connectorly officially support these third-party platforms?
Not necessarily. Connectorly’s prebuilt reporting models, measures, templates and detailed documentation are primarily designed for Power BI. Customers are generally responsible for configuring and maintaining reports in other platforms.
Why does Connectorly recommend Power BI?
Power BI provides the most complete Connectorly experience. Customers can use prebuilt models, relationships, calculations and report templates instead of creating the entire reporting solution from the beginning.
Will another reporting tool see the same Connectorly data?
The tool queries the same permitted PostgreSQL tables and views. However, the resulting model, calculations and visualisations may differ because every reporting platform handles relationships, data types and calculations differently.
Can I connect more than one reporting platform?
It may be technically possible to connect multiple compatible tools to the same Connectorly database. However, concurrent connections and frequent queries can increase database workload, so the intended usage should be tested carefully.
Can a reporting tool change my Xero or HubSpot data?
No. Connectorly supplies a dedicated read-only database user for reporting. The connection cannot be used to write changes back to Xero, HubSpot or the Connectorly database.
What should I test before using another platform in production?
Test authentication, SSL or TLS configuration, access to the required schemas, supported data types, query performance, refresh behaviour and the platform’s ability to handle the expected number of rows.