
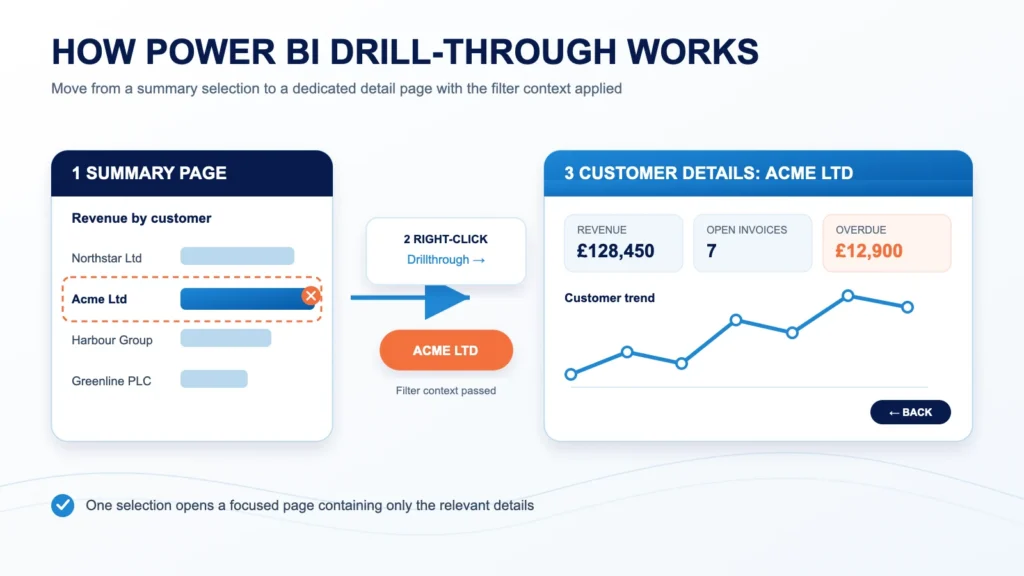
A Power BI drill-through page allows report users to move from a summary visual to a detailed page filtered for the selected item. For example, a user can right-click a customer, sales representative, account or product and open a page showing only the records related to that selection.
Drill-through makes reports easier to explore without overcrowding the main dashboard. Summary pages can remain focused on key trends and KPIs, while dedicated detail pages provide transaction-level data, supporting measures and additional context.
In this step-by-step guide, you will learn how to create a Power BI drill-through page, configure its filters, add a back button and test the user experience. The same technique can be used with financial, sales, CRM and operational data. If you are new to the platform, start with our complete Power BI guide for beginners.
What Is a Power BI Drill-Through Page?
A Power BI drill-through page is a dedicated report page that displays detailed information about a value selected on another page. Power BI passes the selected value to the drill-through page and uses it as a filter.
For example, from a summary report you could drill through on:
- A customer to view invoices, sales and outstanding balances
- A company to examine deals, contacts and sales activities
- A sales representative to review pipeline and performance
- An account to inspect general ledger transactions
- A product to analyse revenue, quantity and profitability
Drill-through is different from drilling down within a visual. Drill-down moves between levels of a hierarchy, such as year, quarter and month. Drill-through opens a separate report page containing more information about the selected item.
The detail page can contain KPI cards, charts, tables and other visuals. Because the selected field is applied as a filter, every relevant visual on the page updates automatically.
Step 1: Create and Name the Detail Page
Open your report in Power BI Desktop and select the + icon beside the existing page tabs. This creates the destination page that users will open when they drill through from a summary visual.
Rename the new page so its purpose is immediately clear. Suitable names include:
- Customer Details
- Company Details
- Account Transactions
- Product Analysis
- Sales Representative Details
For this tutorial, imagine that we are creating a page called Customer Details. The page will open for one selected customer and display headline measures, trends and detailed records related to that customer.
Keep the page visible while building and testing it. Once the drill-through experience works correctly, you can hide the page so users reach it through report navigation instead of selecting its page tab directly.
Microsoft’s current setup also begins by creating and naming a dedicated destination page before adding the drill-through field. You can review the official guidance in the Microsoft Power BI drill-through documentation.
Step 2: Add the Drill-Through Field
Select the new Customer Details page. In the Visualizations pane, locate and expand the Drillthrough section.
From the Data pane, drag the field that identifies the selected item into the area labelled Add drill-through fields here. For this example, add the Customer Name field.
The field you choose controls which selections can open this page. Depending on your report, you might use:
- Customer Name or Customer ID
- Company Name or Company ID
- Account Name or Account Code
- Product Name or Product ID
- Owner Name or Owner ID
Where possible, use a field that uniquely identifies the item. Names can be duplicated or changed, whereas an ID or account code is usually more reliable. You can still display a readable name in the page title and visuals.
After the field is added, Power BI configures the page as a drill-through destination and normally adds a back button automatically. The selected field will also appear as a drill-through filter for the page.
Step 3: Decide Whether to Keep All Filters
In the Drillthrough section, Power BI provides a Keep all filters option. This controls whether the destination page receives only the drill-through field or also carries additional filter context from the source page.
When Keep All Filters Is On
Power BI passes other relevant filters to the detail page. For example, if the source page is filtered to a particular year, region or sales representative, those selections can remain active after the user drills through.
This is useful when the detail page should preserve the context in which the user found the selected item.
When Keep All Filters Is Off
The destination page focuses primarily on the field placed in the drill-through area. This can provide a broader history for the selected customer, account or product instead of limiting the results to every filter applied on the source page.
Choose the setting based on the purpose of the page:
- Turn it on when users need details within the current reporting context.
- Turn it off when users should see a more complete view of the selected item.
Test both options with realistic report filters. A page can appear to be missing data simply because an unexpected source-page filter has been carried through.
Step 4: Build the Detail Page
Add visuals that help users understand the selected customer without recreating the entire summary dashboard. A useful drill-through page might include:
- KPI cards for revenue, outstanding balance or open pipeline
- A line chart showing performance over time
- A breakdown by product, account, stage or category
- A detailed table of transactions, invoices, deals or activities
- Contact details or other useful descriptive information
Every visual that is connected to the drill-through field should update automatically for the selected item.
Create a Dynamic Page Title
A dynamic title reassures users that the page has been filtered correctly. You can create a measure similar to this:
Drillthrough Page Title =
"Customer Details: "
    & SELECTEDVALUE(
        'Customers'[Customer Name],
        "Multiple Customers"
    )
Replace the table and field names with those used in your model. Add the measure to a card visual or use it as a conditionally formatted visual title.
Keep the layout focused on details that add value after the user leaves the summary page. Avoid repeating every chart from the source page.
Step 5: Configure the Back Button
Power BI normally adds a back button when you place a field in the drill-through area. This button returns the user to the page and filter context from which they arrived.
Select the button and review its formatting. Make sure it is:
- Easy to find near the top-left or top-right of the page
- Large enough to select comfortably
- Consistent with the colours and navigation used elsewhere in the report
- Supported by a clear tooltip or text label where necessary
If the automatic button is missing, create one from Insert > Buttons > Back. In the button settings, confirm that Action is enabled and its type is set to Back.
When testing inside Power BI Desktop, hold Ctrl while selecting the button. Report users can select it normally after the report is published to the Power BI service.
Step 6: Test the Drill-Through Page
Return to the summary page and find a visual containing the same field used in the drill-through configuration. In this example, the source visual must contain Customer Name or the corresponding customer field from the model.
- Right-click a customer in the visual.
- Point to Drillthrough in the context menu.
- Select Customer Details.
- Confirm that the destination page shows only the selected customer.
- Use the back button to return to the summary page.
Test the page with several different selections. Check that the title, KPI cards, charts and detail table all respond correctly.
If the drill-through page does not appear in the menu, confirm that:
- The destination page contains a field in the drill-through area
- The source visual contains the same field
- You are right-clicking an individual data point rather than an empty area
- The field is not being used only as an aggregated value
- The relationships in the data model allow the selected field to filter the detail visuals
Step 7: Hide the Drill-Through Page
Once the page has been tested, you can hide it from the standard page navigation. This encourages users to open it through the intended drill-through journey instead of selecting an unfiltered detail page directly.
- Right-click the Customer Details page tab.
- Select Hide page.
- Save and republish the report.
A hidden page remains available as a drill-through destination. It can also still be opened through buttons or other configured navigation.
Keep the page visible while developing or troubleshooting the report. Hiding it too early can make testing less convenient.
Optional: Add a Drill-Through Button
Right-click navigation is useful, but some report users may not discover it. A drill-through button can make the available action more visible.
- Open the summary report page.
- Select Insert > Buttons and choose a suitable button style.
- Enable Action in the button settings.
- Set the action type to Drillthrough.
- Select Customer Details as the destination page.
- Give the button a clear label, such as View Customer Details.
The user must select a valid customer or data point before the button can perform the drill-through action. Configure the button’s disabled state and tooltip so it is clear that a selection is required.
A visible button is particularly helpful for executive dashboards, mobile layouts and reports intended for occasional Power BI users.
Using Multiple Drill-Through Fields
You can add more than one field to the drill-through area when the destination page needs a more specific context.
For example, a financial detail page might use:
- Organisation
- Account Code
A sales detail page might use:
- Pipeline
- Deal Owner
Multiple fields can help when the same value appears in different parts of the business. However, they also make the drill-through requirement more restrictive because the necessary context must be available from the source visual.
Start with one reliable field whenever possible. Add more fields only when they solve a genuine ambiguity or support a specific navigation requirement.
Practical Power BI Drill-Through Examples
Customer Aged Receivables
From an aged receivables summary, users can drill through on a customer to view unpaid invoices, due dates, ageing buckets and outstanding balances. This works particularly well with the approach described in our Power BI aged receivables dashboard guide.
HubSpot Company or Deal Details
From a HubSpot pipeline page, users can drill through on a company, owner or deal to review related contacts, sales activities, amounts and expected close dates. This adds useful detail without overcrowding the main HubSpot sales pipeline dashboard.
General Ledger Transactions
From a profit and loss statement or account summary, users can drill through on an account to inspect the underlying journal lines and transaction descriptions. This creates a natural path from financial statements to audit-level detail.
Sales Representative Performance
From an executive sales dashboard, users can drill through on a representative to view their pipeline, won revenue, activities, overdue tasks and individual deals.
Common Power BI Drill-Through Problems
The Drill-Through Page Does Not Appear
Confirm that the field in the destination page’s drill-through area is also present in the source visual. Use the same field from the same table rather than a similarly named column from another table.
The Detail Page Is Blank
Check the model relationships and confirm that the selected field can filter the tables used by the destination visuals. Also review any page-level, visual-level or carried-through filters that may remove all records.
Too Many Filters Are Applied
If the page shows fewer records than expected, inspect the Keep all filters setting. Filters inherited from the source page may be narrowing the results.
Different Items Share the Same Name
Names are not always unique. Use a customer ID, account code, deal ID or product ID when duplicate names could produce ambiguous results.
Users Do Not Discover the Feature
Right-click navigation is not obvious to every user. Add a drill-through button, tooltip or short instruction to make the detail page easier to find.
The Back Button Does Not Work During Testing
In Power BI Desktop’s editing mode, hold Ctrl while selecting the back button. In the published report, users can select it normally.
Power BI Drill-Through Best Practices
- Give the page a clear purpose. Build each drill-through page around one entity or analytical question.
- Use stable identifiers. IDs and account codes are safer than names when duplicate or changing values are possible.
- Show the selected context. Add a dynamic title so users can immediately see which customer, account or product they are viewing.
- Keep the layout focused. Include details that support investigation rather than repeating the entire summary page.
- Provide an obvious return path. Position the back button consistently across detail pages.
- Test inherited filters. Check how date, organisation, region and owner selections behave with Keep all filters.
- Make navigation discoverable. Consider adding a button or tooltip instead of relying entirely on right-click navigation.
- Test in the Power BI service. Confirm that navigation, buttons, tooltips and mobile layouts behave correctly after publication.
Final Thoughts
A Power BI drill-through page creates a clear path from summary information to supporting detail. It allows the main dashboard to remain focused while still giving users access to customer records, transactions, deals, activities or other underlying information.
The basic process is straightforward: create a destination page, add a drill-through field, design the detail visuals and test the navigation from a source visual. A dynamic title, clear back button and carefully chosen filter settings make the experience easier to understand.
Start with one well-defined detail page and one reliable identifying field. Once it works correctly, you can apply the same approach to customers, accounts, products, sales representatives and other important dimensions throughout your Power BI reports.
Frequently Asked Questions
What is a Power BI drill-through page?
A Power BI drill-through page is a dedicated detail page that opens filtered to a value selected on another report page. It allows users to move from summary information to detailed records for a customer, account, product, sales representative or another entity.
How do I create a Power BI drill-through page?
Create a new report page, then drag the field you want to use into the Drillthrough filters area. Add the required visuals and test the page by right-clicking the same field in a source visual and selecting the drill-through destination.
Why does my drill-through page not appear?
The most common reason is that the source visual does not contain the same field used in the destination page’s drill-through area. Also check the model relationships and confirm that you are right-clicking an individual data point.
What does Keep All Filters do in Power BI drill-through?
Keep all filters passes additional filter context from the source page to the drill-through page. Turn it on when the detail page should retain selections such as date, organisation or region. Turn it off when users need a broader view of the selected item.
Can a Power BI drill-through page use multiple fields?
Yes. You can add multiple fields to the drill-through area when the page needs compound filtering. However, the required context must be available from the source visual, so using several fields can make the navigation more restrictive.
Can I use a button instead of right-clicking?
Yes. Add a button to the source page, enable its action, set the action type to Drillthrough and choose the destination page. The user must first select a valid data point that provides the required filter context.
Should a drill-through page be hidden?
It is usually helpful to hide the page after testing. The page remains available through drill-through navigation, but users will not see it among the standard report page tabs.