Why so many teams still rely on Excel for reporting
We regularly speak to finance teams, operations managers, and Power BI developers who are still building critical reports in Excel. In many businesses, Excel became the default reporting tool years ago because it was accessible, flexible, and familiar.
At first, it works well. Someone exports a CSV file from Xero. Another person downloads HubSpot deals into a spreadsheet. A few formulas and pivot tables are added, and the report is ready.
The problem is not Excel itself. Excel is still extremely useful for analysis and ad hoc work. The issue starts when spreadsheet-based reporting becomes the long-term reporting strategy for the business.
This is where reporting becomes difficult to maintain, hard to trust, and increasingly time-consuming.
Why manual Excel reporting stops scaling
Most reporting problems do not appear immediately. They develop gradually as data volume increases and more systems become involved.
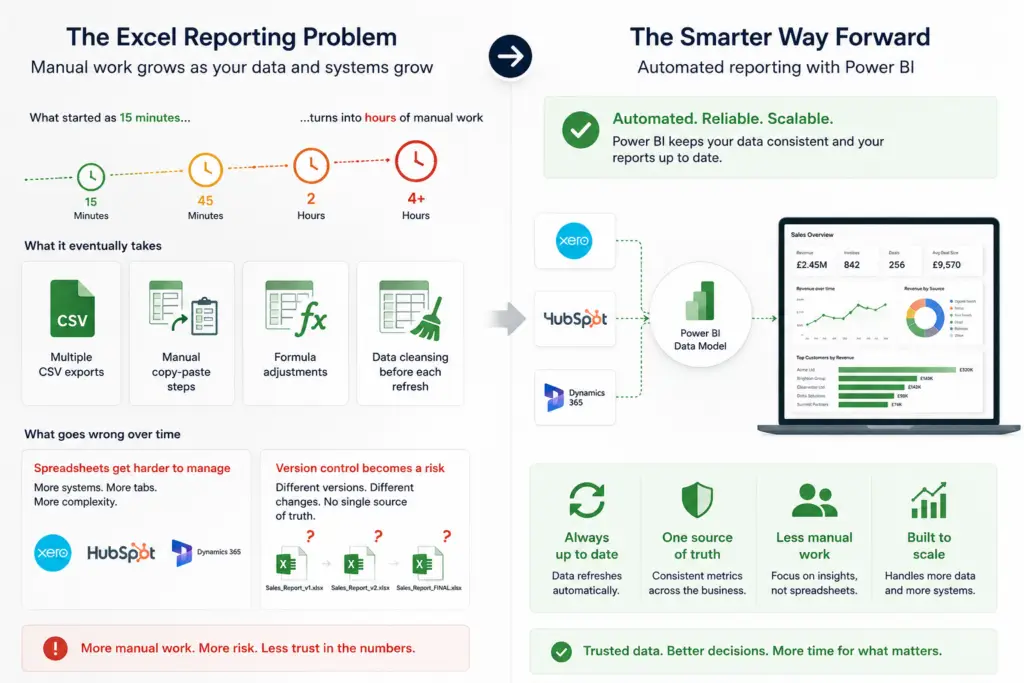
A report that once took 15 minutes to update may eventually require:
- Multiple CSV exports
- Manual copy-paste steps
- Formula adjustments
- Data cleansing before each refresh
Once teams start combining data from systems like Xero and HubSpot, spreadsheets become harder to manage reliably.
Version control also becomes a problem. Different people save different versions of the same report, often with small changes to formulas or filters. Eventually, nobody is fully confident which file contains the correct numbers.
This is one of the main reasons businesses begin moving towards automated reporting platforms such as Power BI.
What are the biggest risks of Excel-based reporting?
The biggest issue is manual handling. Every time someone exports data manually, there is a risk of:
- Missing records
- Incorrect filters
- Broken formulas
- Outdated data is being shared
Excel also struggles with large datasets and complex relationships between tables. For example, linking HubSpot deal data with Xero invoice data inside spreadsheets quickly becomes difficult to maintain.
Another challenge is refresh consistency. Excel reports usually depend on users remembering to repeat the same process every day, week, or month. If steps are skipped or changed, reports lose accuracy.
These issues are not theoretical. They are common operational problems that affect reporting quality across finance and sales teams.
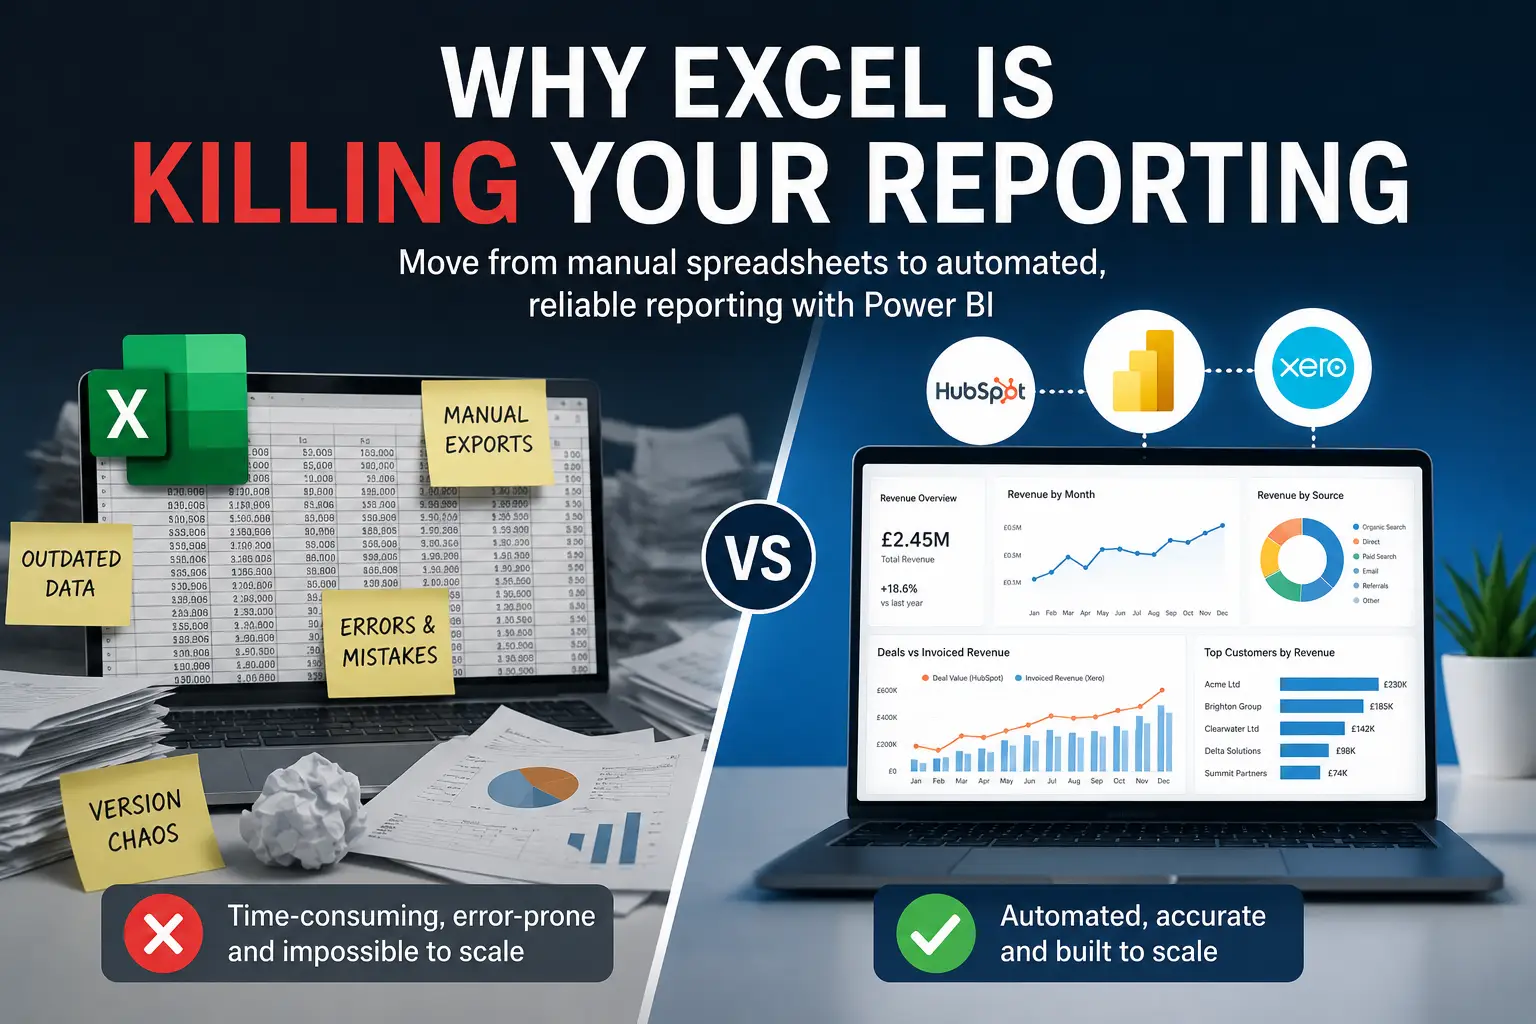
Why automated reporting works differently
Automated reporting changes the workflow completely. Instead of repeatedly exporting data into spreadsheets, systems connect directly to a reporting platform such as Power BI. Data is refreshed automatically and stored in a structured model.
This removes repetitive manual tasks and creates a consistent reporting environment.
For example:
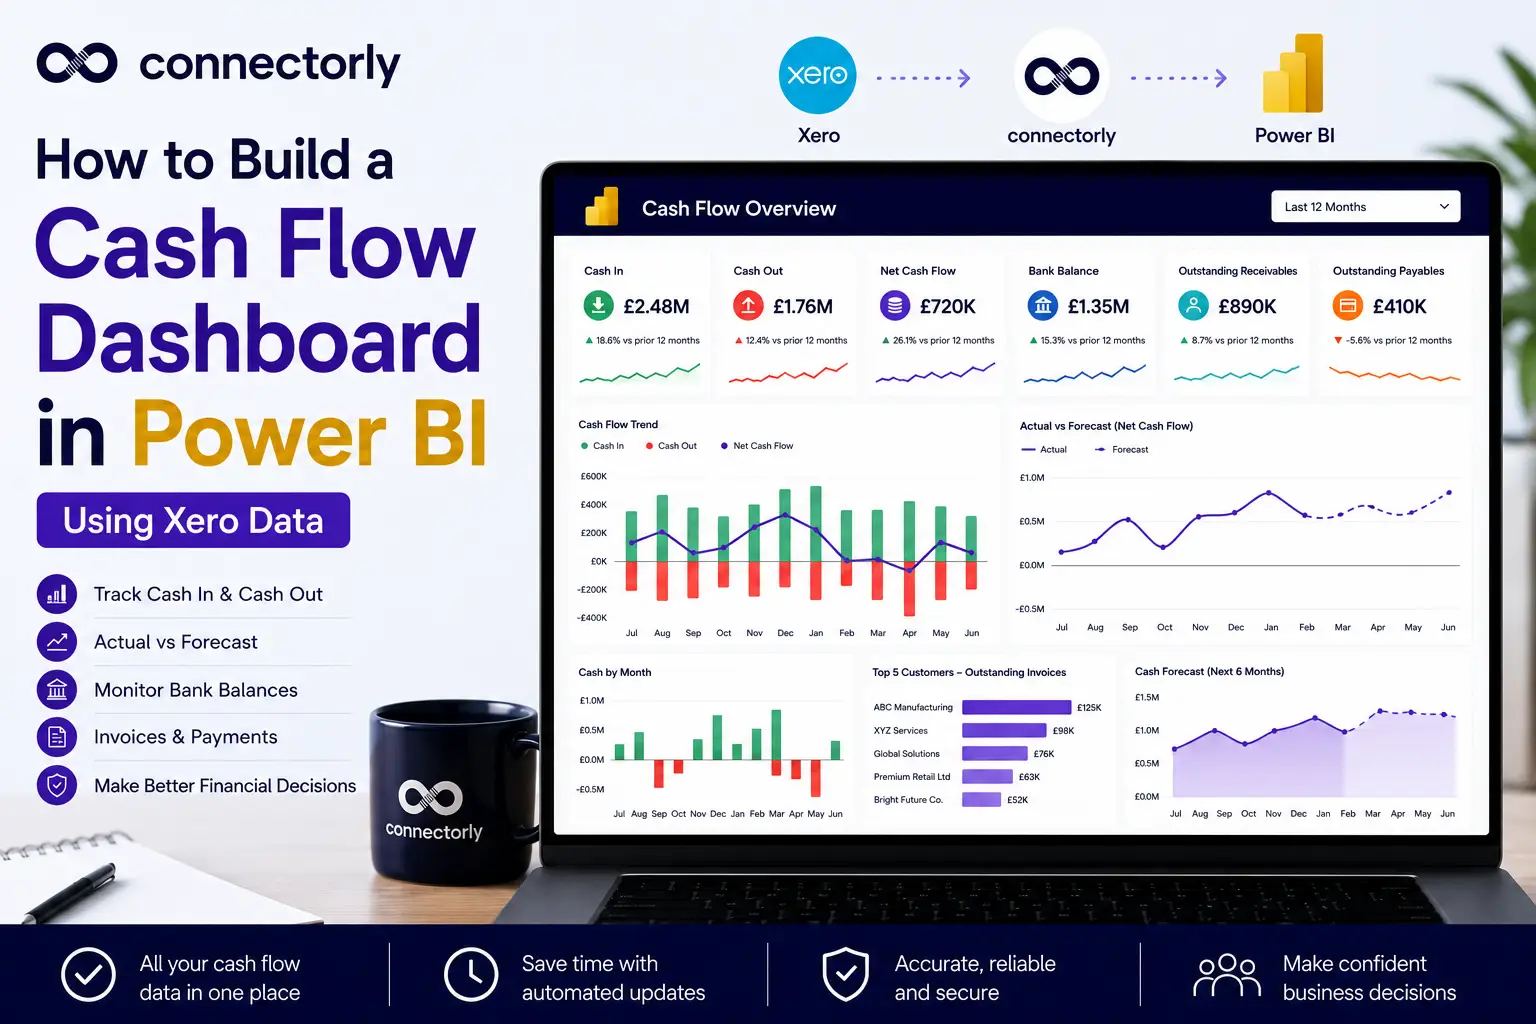
- Connectorly for Xero & Power BI
- Connectorly for HubSpot & Power BI
- Connectorly for Xero Projects 365 & Power BI
allow businesses to connect operational and financial systems into Power BI without relying on repeated spreadsheet exports.
This does not mean Excel disappears completely. It simply means Excel is no longer acting as the reporting database.
Why Excel creates hidden reporting inconsistencies
One of the most common problems with spreadsheet reporting is that data definitions change over time.
For example:
- One spreadsheet filters cancelled invoices
- Another includes them
- One report uses the invoice date
- Another uses the payment date
Because these rules are often embedded inside formulas, inconsistencies become difficult to detect.
Power BI approaches reporting differently. Measures and relationships are centralised in the data model, which means calculations are defined once and reused consistently across reports.
This is particularly important when combining systems such as HubSpot and Xero, where data relationships need to remain stable.
Can Excel still be useful alongside Power BI?
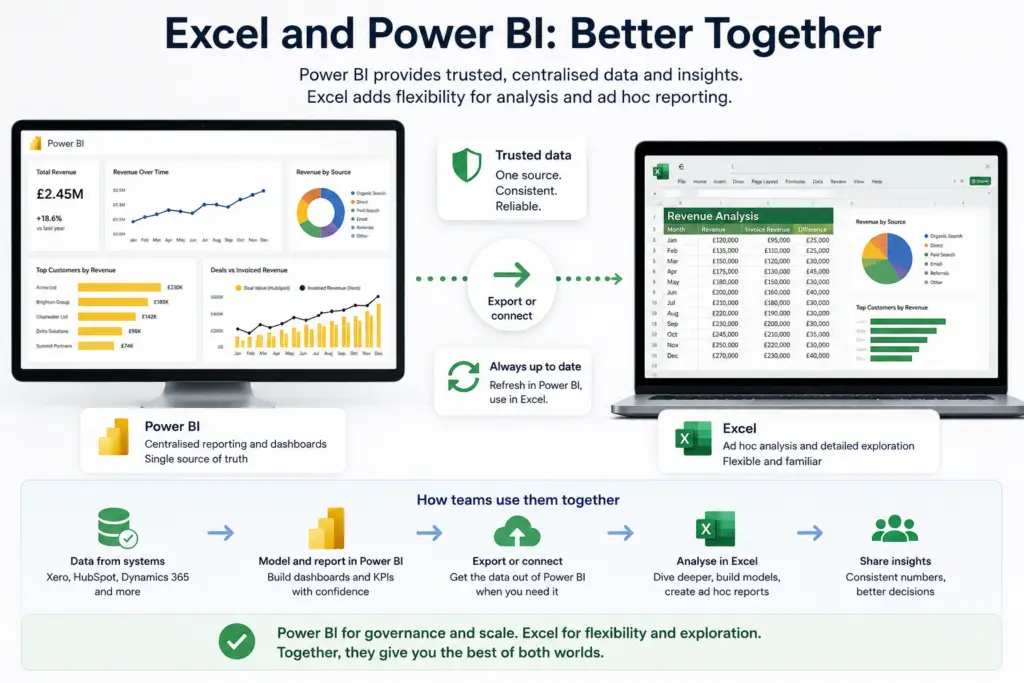
Yes. Excel is still valuable for:
- Ad hoc analysis
- Pivot tables
- One-off exports
- Offline calculations
The key difference is that Excel should consume trusted data rather than becoming the primary reporting engine.
For example, many teams use Power BI for central reporting and then export filtered datasets into Excel for further analysis.
Connectorly already supports workflows like this. If teams need Excel access, they can still connect to structured datasets rather than relying on repeated CSV exports.
Relevant guides include:
These workflows are far more reliable than rebuilding reports manually each month.
What happens when reporting depends on spreadsheets?
As businesses grow, spreadsheet reporting creates operational bottlenecks.
Teams begin spending more time maintaining reports than analysing them.
Common symptoms include:
- Reports are taking hours to update
- Multiple versions of the same file
- Data mismatches between departments
- Broken formulas after structural changes
- Difficulty auditing calculations
These are usually signs that reporting has outgrown spreadsheets.
Power BI solves many of these problems by separating:
- Data storage
- Data modelling
- Visualisation
This creates a more stable reporting structure.
Why Power BI is better suited for multi-system reporting
Modern reporting often involves multiple platforms:
- HubSpot for CRM
- Xero for finance
Excel is not designed to manage large-scale relationships across these systems.
Power BI allows datasets to be linked through structured relationships. For example:
- HubSpot deal values can be compared against Xero invoices
- Revenue trends can be analysed across multiple organisations
- Dashboards can refresh automatically without manual intervention
Connectorly helps simplify this process by preparing datasets before they reach Power BI, reducing the need for manual API handling or spreadsheet manipulation.

How to move away from spreadsheet-heavy reporting
Most businesses do not replace Excel overnight.
A more practical approach is:
- Automate the data pipeline first
- Centralise reporting in Power BI
- Continue using Excel only where it adds value
This allows teams to keep familiar workflows while reducing the risks created by manual reporting.
In many cases, businesses discover they spend significantly less time maintaining reports once the export-and-copy process disappears.
Recommended further reading
To explore related topics further, consider linking to:
- Bring your Xero data to Power BI
- Bring your HubSpot data to Power BI
- Export your Power BI report to Excel
- Bring your Xero or HubSpot data into Excel
These articles provide practical next steps for moving from spreadsheet-based workflows to structured reporting.
Final thoughts
Excel is not the problem. Manual reporting is.
Spreadsheets remain useful for analysis and flexibility, but they become risky when they act as the foundation for business reporting.
As reporting requirements grow, businesses need:
- Consistent datasets
- Reliable refresh processes
- Clear data relationships
- Centralised calculations
This is where automated reporting platforms such as Power BI become more effective.
Connectorly helps bridge this gap by connecting systems like Xero and HubSpot into structured reporting environments that work reliably at scale.