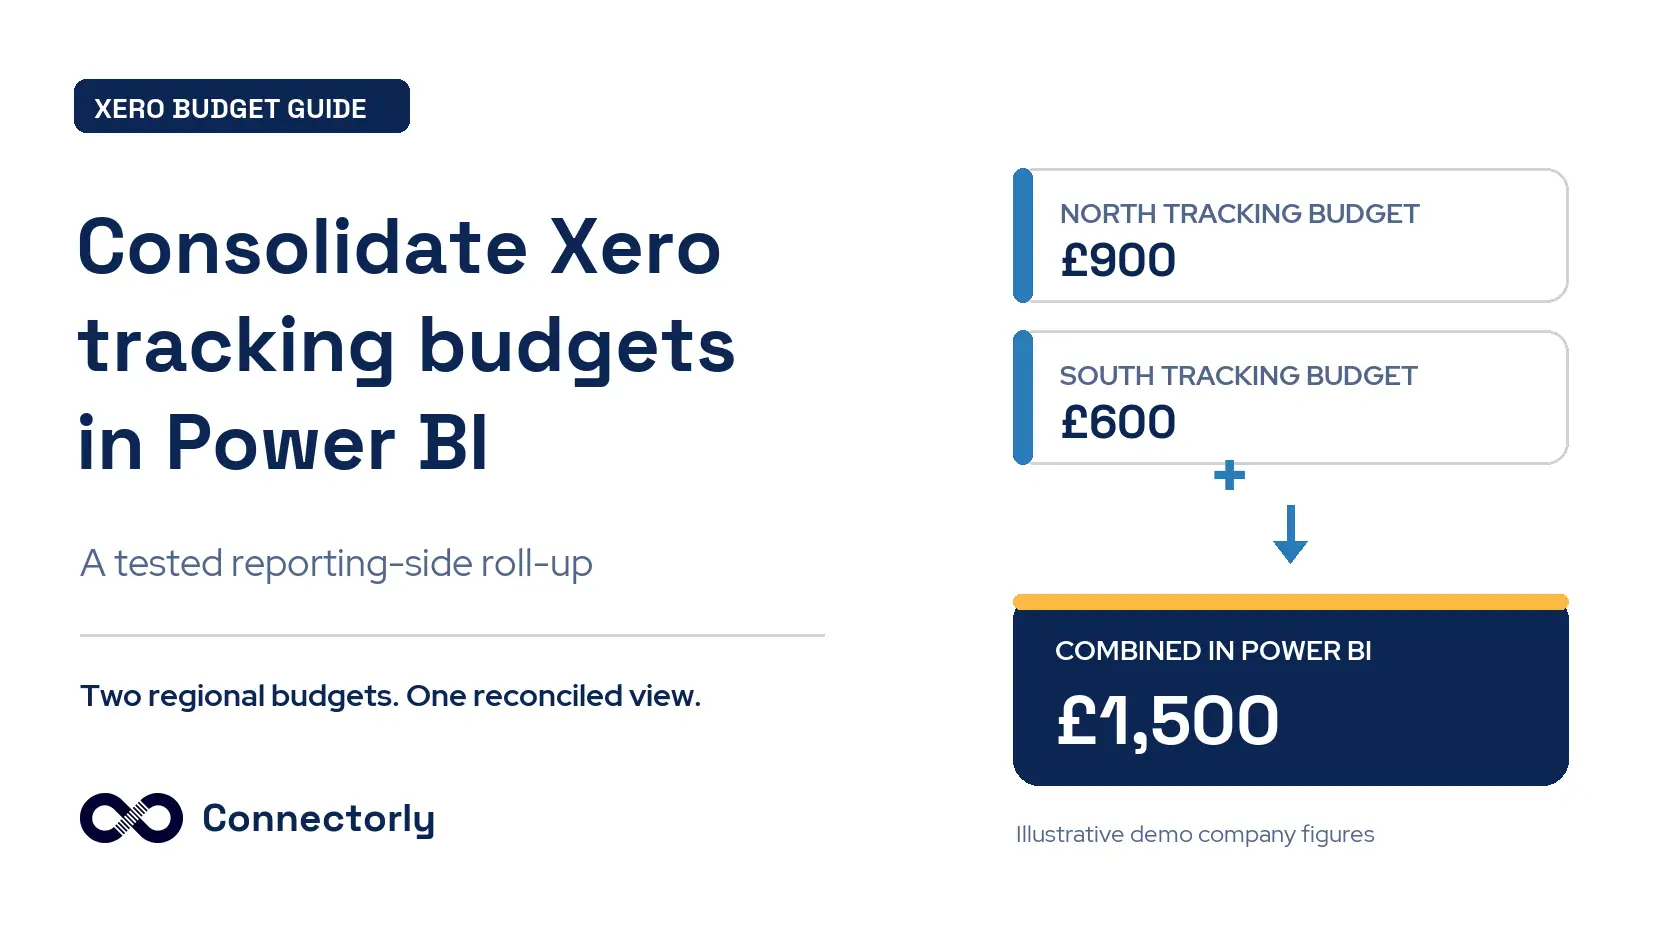
If you manage separate budgets for each region, department or project in Xero, how do you see what they add up to? Xero lets you create a budget for each tracking option, but it does not automatically roll those budgets into its Overall Budget.
Xero’s product idea for this feature is currently marked “Not in pipeline.” Xero says the automatic roll-up is not on its immediate roadmap. That is a statement about its current plans, not a claim that the feature will never be built.
You can create the combined view in Power BI. This guide shows how to bring selected tracking budgets together, compare them with actuals for the same tracking options, and check the results against Xero. We use a worked example from Xero’s Demo Company UK that we tested in Power BI and reconciled to Xero’s Budget Summary and Budget Variance reports.
The combined budget exists in the Power BI report. It does not update Xero’s Overall Budget.
What Xero Does With Tracking Budgets
Xero lets you create a separate budget for each tracking option. For example, you can budget for North and South under a Region tracking category, then compare each region’s budget with its actual results.
The missing step is automatic consolidation. Xero does not currently add those separate tracking budgets together to populate its Overall Budget. Xero has acknowledged this request and marked it “Not in pipeline”.
The distinction matters when you report on budget performance. Selecting a North budget does not, by itself, mean the actuals are filtered to North. In our Demo Company UK test, Xero’s Budget Variance report initially showed actuals from both test regions alongside the North budget. Applying the Region: North filter produced the correct like-for-like comparison.
To build a combined report, we need to select the tracking budgets we want to include, add their amounts by account and period, and compare them with actuals from those same tracking options. We must keep Xero’s Overall Budget and any alternative scenario budgets out of that sum, or the result may count budgets twice.
A Tested Example: Two Regional Budgets
To test the approach, we used Xero’s fictional Demo Company UK. We created two options under the Region tracking category: Connectorly Test North and Connectorly Test South. Each option had its own budget for November 2026.
North
Sales budget: £1,200; actual sales: £1,000
Advertising & Marketing budget: £300; actual expense: £250
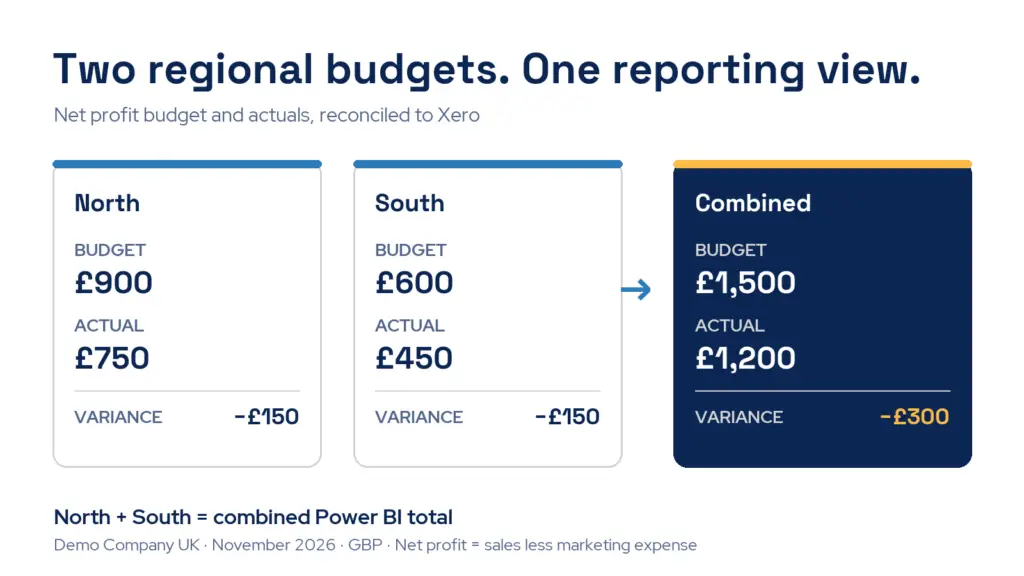
Net profit budget: £900; actual net profit: £750
South
Sales budget: £800; actual sales: £600
Advertising & Marketing budget: £200; actual expense: £150
Net profit budget: £600; actual net profit: £450
Adding the two regional budgets gives £2,000 in sales, £500 in Advertising & Marketing, and £1,500 in net profit. The matching actuals are £1,600 in sales, £400 in Advertising & Marketing, and £1,200 in net profit. Actual net profit is therefore £300 below the combined budget.
We checked each region’s budget in Xero’s Budget Summary report and its actuals in the Budget Variance report with the matching Region filter applied. We then compared those figures with the Power BI results at both account and region level. Every figure matched in this test.
These figures illustrate the method; they are not customer results. The next section shows how the budget and actual data must be filtered to reproduce them.
How to Consolidate Xero Tracking Budgets in Power BI
Connectorly’s Xero data model brings budget amounts, journal actuals, accounts, dates and tracking options into Power BI. The budget data includes a budget name, a budget type, an account code, a date and tracking-option fields. The journal data includes the corresponding actual amounts and tracking information.
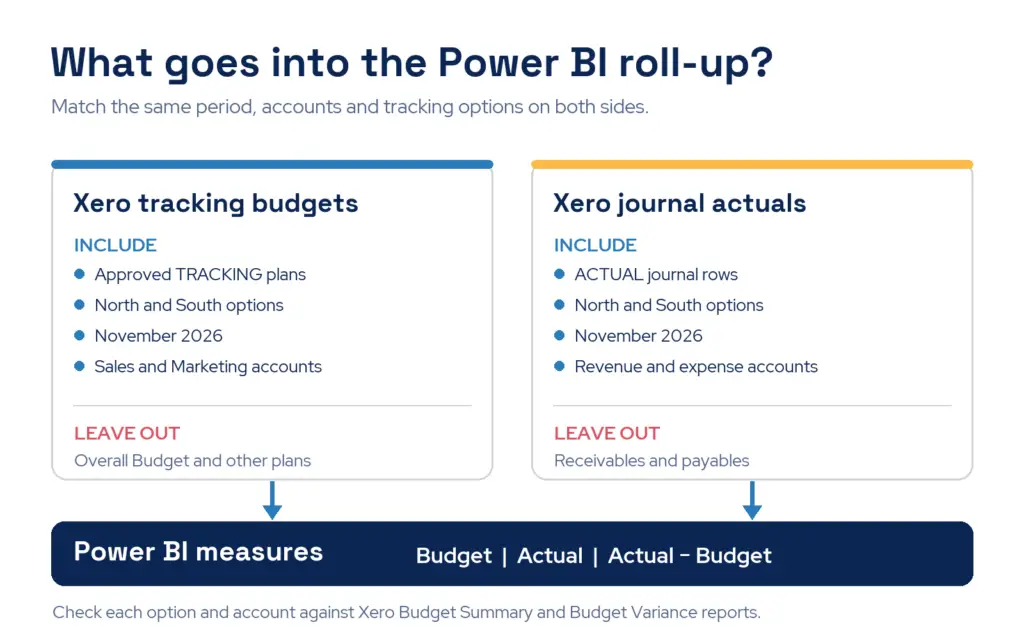
For this report, the budget calculation includes only the two approved tracking budgets we created for North and South. It excludes Xero’s Overall Budget and any other budget plans. This is essential: adding every budget row together would mix separate plans and could overstate the result.
The actuals calculation includes only ACTUAL journal rows for revenue and expense accounts. The journal table also contains balance-sheet entries, such as accounts receivable and accounts payable. Including those entries in a profit comparison would give the wrong total.
Both calculations use the same November 2026 date range and the same North and South tracking options. In the Power BI template we tested, journals are related to the tracking-options table, but budgets are not. Our budget measure therefore passes the selected tracking option to the budget table explicitly, so each region’s row shows its own budget and the grand total adds the two regions.
Connectorly spreads a monthly Xero budget across the days in that month. When you select the full month, those daily budget rows add back to the amount entered in Xero. For a partial month, the result represents the corresponding portion of the monthly budget. Connectorly explains this daily treatment in its budget data guide.
The Power BI Measures Used in Our Test
The following measures produced the North, South and combined figures in our Power BI test. They use the names of the two demo budgets and tracking options, so treat them as a worked example rather than measures ready for every Xero organisation.
Create the budget measure under xero budgets:
CL Test Tracking Budget (RC) =
CALCULATE (
    SUM ( 'xero budgets'[Net Amount (RC)] ),
    KEEPFILTERS ( 'xero budgets'[Type] = "TRACKING" ),
    KEEPFILTERS ( 'xero budgets'[Status] = "APPROVED" ),
    KEEPFILTERS (
        'xero budgets'[Budget Name] IN {
            "Connectorly Test North - Nov 2026",
            "Connectorly Test South - Nov 2026"
        }
    ),
    KEEPFILTERS (
        TREATAS (
            VALUES ( 'xero tracking_categories'[Tracking Option] ),
            'xero budgets'[Tracking Option 0]
        )
    )
)
The TREATAS step passes the tracking option selected in the report to the budget rows. It is needed here because this template has no direct relationship between its budgets and tracking-options tables. Microsoft documents TREATAS for filtering an unrelated table.
Create the actuals measure under xero journals:
CL Test Tracking Actual (RC) =
CALCULATE (
    SUM ( 'xero journals'[Net Amount (RC)] ),
    KEEPFILTERS ( 'xero journals'[Journal Type] = "ACTUAL" ),
    KEEPFILTERS ( 'xero accounts'[Class] IN { "Revenue", "Expense" } ),
    KEEPFILTERS (
        'xero journals'[Tracking Option 0] IN {
            "Region - Connectorly Test North",
            "Region - Connectorly Test South"
        }
    )
)
Create the variance measure under xero budgets:
CL Test Tracking Variance (RC) =
[CL Test Tracking Actual (RC)]
    - [CL Test Tracking Budget (RC)]
In the report, filter xero dates[Date] to 1–30 November 2026. Put xero tracking_categories[Tracking Option] and xero accounts[Account Name] in the rows of a matrix, with all three measures in Values.
The matrix returned a combined net profit budget of £1,500, actual net profit of £1,200, and variance of −£300. It also returned the correct budget, actual and variance for each region and account when compared with Xero’s filtered reports. Expenses appear as negative values in these Power BI measures; Xero’s reports display them as positive expenses.
How to Reconcile the Combined Report to Xero
A combined Power BI total is useful only if you can trace it back to the budgets and transactions in Xero. Check the selected month and each tracking option before relying on the grand total.
Check each budget separately. In Xero’s Budget Summary report, select the first tracking budget and record its amounts by account for the month. Repeat for every budget included in the Power BI total. In our test, North and South had November sales budgets of £1,200 and £800, which add to £2,000.
Filter actuals to the same option. In Xero’s Budget Variance report, select the budget, set the month, and apply the matching tracking-option filter. Do not assume that choosing a budget also filters actuals. Our first unfiltered North report showed actuals from both regions; applying Region: Connectorly Test North gave the correct £1,000 sales actual.
Compare account lines in Power BI. Use the same month, organisation, tracking options and reporting currency. Compare each region and account with its Xero report before checking the Power BI grand total. In our test, both Sales and Advertising & Marketing matched for North and South.
Check the combined arithmetic. The two sales budgets add to £2,000 and the two marketing budgets add to £500. That gives a combined net profit budget of £1,500. Actual sales of £1,600 less actual marketing expense of £400 give £1,200 net profit, or £300 below budget.
Review what is excluded. Check for transactions without a tracking option, budgets for other scenarios, and amounts assigned to a second tracking category. Decide how each should be reported before treating the combined total as a complete organisation-wide budget.
This reconciliation confirms a Power BI reporting total built from selected tracking budgets. It does not show that Xero’s Overall Budget has changed, and the combined figure should not be described as Xero’s native Overall Budget.
When to Use This Approach
A Power BI roll-up is useful when you maintain separate Xero budgets by tracking option and need one report showing their combined budget, actuals and variance. It lets you keep the regional or departmental detail while also seeing the total for the options you selected.
The measures above were tested with one Xero demo organisation, one month and one tracking category. Their budget names and tracking options are written directly into the formulas. For an ongoing report, you would replace those fixed selections with a controlled way to choose the relevant budget for each option and period.
Before applying the method to your own data, check whether any option has more than one budget plan, whether actual transactions lack tracking, and whether you use a second tracking category. Confirm that account classifications, reporting currency and date filters match the Xero reports you are using for reconciliation. These choices affect what belongs in the combined total.
A roll-up of selected tracking budgets may also differ from a separately maintained Overall Budget in Xero. Treat that difference as something to investigate and explain, rather than forcing the two figures to match. The Power BI calculation gives you a reporting view; it does not change budget records in Xero.
Frequently Asked Questions
Can Xero automatically combine tracking budgets into its Overall Budget?
No. Xero supports separate budgets for tracking options, but its request to roll them automatically into the Overall Budget is currently marked “Not in pipeline”. You can calculate a combined reporting total in Power BI, but that does not update the Overall Budget in Xero.
Can I compare one tracking budget with actuals inside Xero?
Yes. Use Xero’s Budget Variance report and apply the matching tracking-option filter. In our test, selecting the North budget without filtering Region showed actuals from both North and South. Adding the North filter produced the correct comparison.
Where should I set up the tracking options and budgets?
Create and maintain them in Xero. Our guide to setting up Xero tracking categories covers the options and their use on transactions. For the broader budget workflow, see Simplifying Budget Management with Xero and Connectorly.
Can I use the example DAX measures unchanged with my own Xero data?
No. The measures above contain the names of our two demo budgets and tracking options. They also use the first tracking-category field in the tested template. Adapt the budget selection, tracking fields, organisation and currency rules to your model, then reconcile the results with Xero before using them for decisions.
Why might my Power BI total differ from Xero?
Check that both reports use the same period, accounts, tracking options and currency. Look for other budget plans included in the sum, actual transactions with no tracking option, and differences in how expenses are displayed. Compare each option and account first; investigate any difference before relying on the grand total.
When is a broader Xero reporting model useful?
A tracking-budget roll-up solves one specific reporting problem. If you also need management reports across periods, organisations or other business systems, our guide to Xero reporting in Power BI explains the wider modelling and reconciliation considerations.
Bring Your Tracking Budgets Into One Report
Xero can hold a separate budget for each tracking option. In our tested example, we brought two of those budgets into one Power BI report, compared them with the matching actuals, and reconciled every account and regional total to Xero.
The result is a combined reporting view that retains the North and South detail. It does not change Xero’s Overall Budget. For your own organisation, the budget selection and reconciliation checks need to reflect your accounts, tracking setup and reporting periods.
Connectorly for Xero and Power BI provides the budget and actual data used in this example. If you want to see how your tracking budgets could be reported together, book a demo and bring your budget structure and reporting questions.