Sales teams collect a large amount of information in HubSpot, but individual deal records do not automatically provide a clear view of overall performance. A well-designed set of HubSpot sales KPIs in Power BI can turn that CRM data into practical measures for pipeline health, conversion, revenue and sales-team performance.
In this guide, we will use the Connectorly HubSpot and Power BI data model to create essential sales KPIs with practical DAX examples. We will cover measures such as open pipeline value, weighted pipeline, won revenue, win rate, average deal value and average sales-cycle length.
These measures can be used as the foundation for sales dashboards, management reports and executive scorecards. However, every KPI must have a clear definition. Differences in date fields, pipelines, currencies, deal stages and record status can otherwise cause Power BI and HubSpot to show different results.
If you need a broader overview of the available connection methods, HubSpot objects and reporting architecture, read our complete guide to HubSpot reporting in Power BI. For a dashboard focused specifically on open opportunities, see our guide to building a HubSpot sales pipeline dashboard in Power BI.
What Are HubSpot Sales KPIs?
HubSpot sales KPIs are measurable values used to evaluate the health of the sales pipeline, the progress of opportunities and the results achieved by a sales team.
Individual metrics answer different questions. Open pipeline value shows the potential value of active opportunities, while won revenue records completed sales. Win rate measures the proportion of completed deals that were won, and average sales-cycle length indicates how quickly opportunities move from creation to completion.
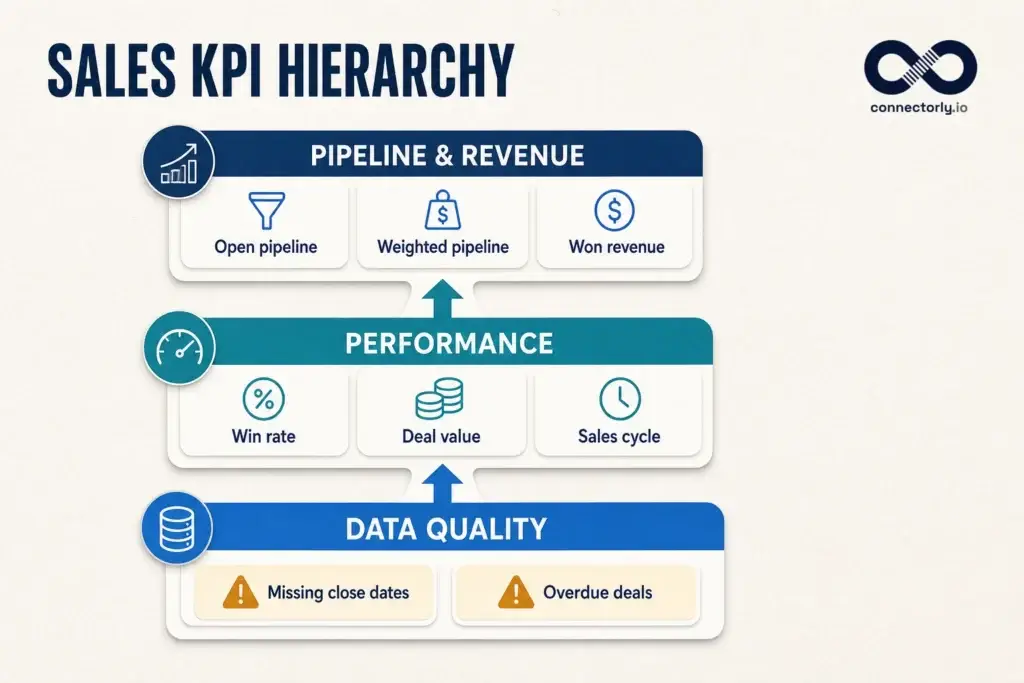
A useful Power BI sales report normally combines three types of KPI:
Pipeline KPIs, which describe current and potential opportunities
Outcome KPIs, which measure won deals and revenue
Efficiency KPIs, which show conversion, speed and representative performance
These groups should be considered together. A large pipeline may appear encouraging, but it provides limited value if conversion is low, expected close dates are outdated or opportunities remain inactive for long periods.
The purpose of a KPI is not simply to display a number. It should help someone understand performance, identify a risk or decide what action to take.
Prepare the HubSpot Data Model
Before creating the KPIs, confirm that the relevant HubSpot tables and relationships are available in Power BI.
For this guide, the primary Connectorly tables are:
hubspot deals for deal values, statuses, dates, owners and pipeline information
hubspot deal_pipelines for stage labels, stage order and probabilities
hubspot owners for sales-representative details
hubspot dates for filtering and analysing results over time
Depending on the KPI, useful fields from the deals table include:
Deal IDAmount (RC)Closed Amount (RC)Created DateClosed Won DateDays To CloseForecast Close DateForecast ProbabilityIs ClosedIs Closed WonPipeline LabelPipeline Stage LabelOwner IDOwner NameArchived
The (RC) fields contain values in the reporting currency and are particularly useful when a HubSpot account contains deals in several currencies. If the organisation uses only one currency, the standard amount fields may be sufficient.
The dates table should have an appropriate relationship with the deal date required by each calculation. For example, won-revenue reporting should normally use the closed-won date, while pipeline forecasting should use the forecast close date.
Only one relationship between the dates and deals tables can normally be active at a time. Therefore, some measures may need to activate a different date relationship with USERELATIONSHIP.
Before continuing, also confirm how archived deals, test pipelines, missing amounts and blank dates should be treated. These decisions affect every KPI created later in the report.
KPI 1: Open Pipeline Value
Open pipeline value measures the total value of active opportunities that have not yet been closed. It provides a high-level view of the revenue currently moving through the sales process.
Create this measure:
Open Pipeline Value (RC) =
CALCULATE(
    SUM('hubspot deals'[Amount (RC)]),
    'hubspot deals'[Is Closed] = FALSE(),
    'hubspot deals'[Archived] = FALSE()
)
Add the measure to a Card visual and format it as the organisation’s reporting currency.
A high open-pipeline value is not automatically positive. The total may include deals with unrealistic close dates, missing owners or little recent activity. It should therefore be analysed alongside weighted pipeline, deal count, conversion and data-quality measures.
If your model does not contain an Archived field, remove that filter from the measure. You should also apply any agreed exclusions for test pipelines, internal opportunities or other deals that do not belong in the sales forecast.
KPI 2: Weighted Pipeline Value
Weighted pipeline value adjusts each open deal according to its probability of closing. It provides a more cautious view than the full open-pipeline total, although it should never be treated as guaranteed revenue.
Create this measure:
Weighted Pipeline Value (RC) =
SUMX(
    FILTER(
        'hubspot deals',
        'hubspot deals'[Is Closed] = FALSE()
            && 'hubspot deals'[Archived] = FALSE()
    ),
    VAR RawProbability =
        COALESCE(
            'hubspot deals'[Forecast Probability],
            RELATED('hubspot deal_pipelines'[Probability]),
            0
        )
    VAR ProbabilityValue =
        IF(
            RawProbability > 1,
            DIVIDE(RawProbability, 100),
            RawProbability
        )
    RETURN
        'hubspot deals'[Amount (RC)] * ProbabilityValue
)
The measure first uses the deal’s forecast probability. If that value is blank, it uses the probability assigned to the relevant pipeline stage. The calculation also handles models where probability is stored either as a decimal, such as 0.4, or as a percentage, such as 40.
You can also calculate the proportion of the open pipeline represented by the weighted result:
Weighted Pipeline Percentage =
DIVIDE(
    [Weighted Pipeline Value (RC)],
    [Open Pipeline Value (RC)]
)
Review stage probabilities regularly. If they do not reflect actual conversion patterns, the weighted-pipeline KPI may create a false sense of accuracy.
For a deeper forecasting example using expected close dates and sales targets, see our HubSpot sales forecast dashboard in Power BI.
KPI 3: Won Revenue
Won revenue measures the value of deals that have successfully completed the sales process. Unlike pipeline value, it represents an achieved outcome rather than potential future revenue.
Create this measure:
Won Revenue (RC) =
CALCULATE(
    SUM('hubspot deals'[Closed Amount (RC)]),
    'hubspot deals'[Is Closed Won] = TRUE(),
    'hubspot deals'[Archived] = FALSE()
)
If Closed Amount (RC) is not populated in your model, use Amount (RC) instead:
Won Revenue from Deal Amount (RC) =
CALCULATE(
    SUM('hubspot deals'[Amount (RC)]),
    'hubspot deals'[Is Closed Won] = TRUE(),
    'hubspot deals'[Archived] = FALSE()
)
For time-based reporting, the measure should respond to the deal’s closed-won date rather than its creation or forecast date. If the relationship between the dates table and Closed Won Date is inactive, use:
Won Revenue by Close Date (RC) =
CALCULATE(
    [Won Revenue (RC)],
    USERELATIONSHIP(
        'hubspot dates'[Date],
        'hubspot deals'[Closed Won Date]
    )
)
Use this date-aware measure in monthly revenue charts and period comparisons.
Remember that won revenue in HubSpot is a CRM measure. It may not equal invoiced, recognised or received revenue in an accounting system. If the distinction matters, label the KPI clearly and compare it with the relevant finance data rather than presenting the two values as interchangeable.
To compare these commercial stages directly, follow our guide to building a HubSpot and Xero sales-to-cash dashboard in Power BI, from closed-won deals through invoicing and cash collection.
KPI 4: Sales Win Rate
Sales win rate measures the proportion of completed deals that were won. It helps show how effectively qualified opportunities are converted into successful sales.
First, create a measure for won deals:
Won Deals =
CALCULATE(
    DISTINCTCOUNT('hubspot deals'[Deal ID]),
    'hubspot deals'[Is Closed Won] = TRUE(),
    'hubspot deals'[Archived] = FALSE()
)
Next, count all closed deals, including both won and lost opportunities:
Closed Deals =
CALCULATE(
    DISTINCTCOUNT('hubspot deals'[Deal ID]),
    'hubspot deals'[Is Closed] = TRUE(),
    'hubspot deals'[Archived] = FALSE()
)
Then calculate the win rate:
Sales Win Rate =
DIVIDE(
    [Won Deals],
    [Closed Deals]
)
Format the result as a percentage.
For example, if 25 out of 100 completed deals were won, the sales win rate is 25%.
Apply the same closed-deal date logic to both parts of the calculation. Comparing deals created during a period with deals closed during that period can produce a misleading percentage because the numerator and denominator may represent different groups of opportunities.
Win rate should also be analysed by pipeline, owner, deal type and period. A combined company-wide percentage can hide substantial differences between teams or sales processes.
To build this KPI into a complete report, follow our step-by-step guide to creating a HubSpot deal conversion and win rate dashboard in Power BI.
KPI 5: Average Won Deal Value
Average won deal value shows the typical value of a successfully completed opportunity. It can help sales leaders understand deal size, compare customer segments and identify changes in the type of business being won.
Create this measure:
Average Won Deal Value (RC) =
DIVIDE(
    [Won Revenue (RC)],
    [Won Deals]
)
Format the result as currency.
For example, if won revenue is £500,000 across 20 won deals, the average won deal value is £25,000.
This KPI is most useful when viewed over time or divided by relevant dimensions, such as:
Sales owner
Pipeline
Region
Product or service
Customer type
Deal type
Be careful when comparing averages across teams. One unusually large deal can significantly affect the result, particularly when the number of won deals is small. Consider displaying the won-deal count alongside the average so that users can understand the volume behind the KPI.
If deal sizes vary substantially, a median deal value may provide useful additional context. However, the average remains easier to calculate, explain and compare with total won revenue.
KPI 6: Average Sales-Cycle Length
Average sales-cycle length measures how long successful opportunities take to move from creation to completion. It can reveal whether deals are progressing efficiently and whether the sales process is becoming faster or slower.
The Connectorly deals table includes the Days To Close field. Use it to create this measure:
Average Sales-Cycle Length =
AVERAGEX(
    FILTER(
        'hubspot deals',
        'hubspot deals'[Is Closed Won] = TRUE()
            && 'hubspot deals'[Archived] = FALSE()
            && NOT ISBLANK('hubspot deals'[Days To Close])
    ),
    'hubspot deals'[Days To Close]
)
Format the result as a whole number and label the card clearly, for example:
Average Sales Cycle: 42 days
Using won deals provides a completed sales cycle that can be measured consistently. Including open deals would mix finished and unfinished processes and could distort the result.
Analyse the KPI by owner, pipeline, deal type and won period. This can help answer questions such as:
Which pipelines take the longest to complete?
Are larger deals associated with longer sales cycles?
Which owners progress opportunities most efficiently?
Is the sales cycle improving over time?
A shorter sales cycle is not always better. Complex, high-value opportunities may naturally require more time. Interpret the KPI alongside average deal value and win rate rather than treating speed as the only measure of success.
KPI 7: Pipeline Coverage
Pipeline coverage compares the value of open opportunities with the sales target they are expected to support. It helps answer whether the current pipeline is large enough to make the target achievable.
HubSpot may not contain the organisation’s official sales targets, so these can be added from Excel, a database or another planning source. A simple targets table might contain:
Period
Sales owner or team
Target amount
Create the target measure:
Sales Target =
SUM('Sales Targets'[Target Amount])
Then calculate pipeline coverage:
Pipeline Coverage =
DIVIDE(
    [Open Pipeline Value (RC)],
    [Sales Target]
)
Format the result as a decimal with an x suffix, such as 3.2x, or as a percentage if that is easier for users to interpret.
For example, an open pipeline of £800,000 against a £250,000 target produces coverage of 3.2x.
The required coverage level depends on the organisation’s historical win rate, sales cycle and opportunity quality. A company with a 25% win rate may require substantially more than 1x coverage to have a reasonable chance of achieving its target.
Use the same period, owner and currency logic for both pipeline and targets. Otherwise, the ratio may compare unrelated values and appear more reassuring than it should.
KPI 8: Deals Requiring Attention
Headline sales KPIs should be supported by data-quality measures. These identify records that may make pipeline and forecast results less reliable.
Create a measure for open deals whose forecast close date has passed:
Open Deals Past Close Date =
CALCULATE(
    DISTINCTCOUNT('hubspot deals'[Deal ID]),
    FILTER(
        'hubspot deals',
        'hubspot deals'[Is Closed] = FALSE()
            && 'hubspot deals'[Archived] = FALSE()
            && NOT ISBLANK('hubspot deals'[Forecast Close Date])
            && 'hubspot deals'[Forecast Close Date] < TODAY()
    )
)
Next, identify open deals without a forecast close date:
Open Deals Missing Close Date =
CALCULATE(
    DISTINCTCOUNT('hubspot deals'[Deal ID]),
    FILTER(
        'hubspot deals',
        'hubspot deals'[Is Closed] = FALSE()
            && 'hubspot deals'[Archived] = FALSE()
            && ISBLANK('hubspot deals'[Forecast Close Date])
    )
)
You can create similar measures for:
Missing deal amounts
Missing owners
Deals without a recent update
Open deals without a next step
Opportunities remaining in one stage for too long
Display the most important exception counts as small cards or in a dedicated data-quality panel. Add a detail table beneath them so users can identify and correct the relevant HubSpot records.
These measures do more than improve the Power BI report. They encourage better CRM maintenance, which in turn makes pipeline, forecasting and performance KPIs more dependable.
Recommended HubSpot Sales KPI Dashboard Layout
A useful KPI dashboard should present the most important results first and then provide enough context for users to investigate them.
A practical one-page layout is:
Top row: headline KPI cards
Open Pipeline Value
Weighted Pipeline Value
Won Revenue
Sales Win Rate
Average Won Deal Value
Average Sales-Cycle Length
Middle row: trends and comparisons
Won Revenue by Month
Open and Weighted Pipeline by Expected Close Month
Pipeline Value by Stage
Win Rate by Sales Owner
Bottom row: targets and exceptions
Pipeline Coverage
Performance Against Sales Target
Open Deals Past Close Date
Open Deals Missing Close Date
A detailed table of deals requiring attention
Add slicers for period, pipeline and sales owner. Additional filters can be placed in the Power BI filter pane to avoid overcrowding the report.
Use colours consistently. For example, blue can represent open pipeline, teal can represent weighted pipeline or won revenue, and amber or red can highlight targets, overdue dates and data-quality exceptions.
Avoid treating every KPI as equally important. The dashboard should guide the reader from the overall sales position to the trends, comparisons and records that require action.
How to Validate HubSpot Sales KPIs in Power BI
Before publishing the dashboard, compare the Power BI results with HubSpot using a small and controlled set of records.
Start by selecting:
One sales pipeline
One sales owner
A short reporting period
A small number of identifiable Deal IDs
Confirm that both systems use the same:
Deal-status rules
Pipeline and stage filters
Date field
Currency
Amount property
Archived-record treatment
Owner assignment
Refresh point
Trace several deals individually before comparing only the overall totals. Check their amount, stage, owner, close status and relevant dates in both systems.
If a result differs, avoid immediately changing the DAX measure to force a match. First determine whether HubSpot and Power BI are answering the same business question. For example, a report based on deal creation date will naturally differ from one based on closed-won date.
Document the agreed definition of every important KPI. This should include its filters, date basis, currency, exclusions and calculation method. Clear definitions make the dashboard easier to validate, maintain and explain to users.
Common HubSpot Sales KPI Mistakes
Even straightforward sales KPIs can become misleading when the underlying definitions are inconsistent.
Mixing different date fields
Deal creation date, forecast close date and closed-won date answer different questions. Select the appropriate date for each KPI and make the choice clear to report users.
Adding values from different currencies
Do not combine original deal amounts from several currencies into one total. Use the Connectorly reporting-currency fields when the dashboard requires a consistent company-wide value.
Counting association rows as deals
A deal can be associated with several contacts, companies or activities. Measures built from an association or activity table may count the same opportunity more than once. Use the deals table and DISTINCTCOUNT of Deal ID where appropriate.
Treating weighted pipeline as guaranteed revenue
Weighted pipeline is an estimate based on probabilities. It remains dependent on accurate deal amounts, stages, probabilities and expected close dates.
Comparing different populations
Win rate becomes misleading if won deals and total closed deals use different filters or reporting periods. Both parts of the calculation must represent the same population.
Ignoring archived and test records
Archived opportunities, demonstration pipelines and internal deals can inflate totals unless they are deliberately included or excluded.
Using activity volume as a result
A high number of calls, emails or meetings does not automatically indicate strong sales performance. Analyse activity alongside pipeline movement, conversion and revenue outcomes.
Showing KPIs without context
A number alone rarely explains whether performance is improving. Add targets, previous-period comparisons, trends or carefully selected breakdowns to make the result meaningful.
How Connectorly Supports HubSpot Sales Reporting
Connectorly provides a structured route for bringing HubSpot data into Power BI. Instead of relying on recurring CSV exports or building a direct API integration from the beginning, users can connect Power BI to a prepared reporting database.
The Connectorly HubSpot data model makes reporting fields available across areas such as:
Deals and pipelines
Contacts and companies
Owners
Calls, meetings, emails and tasks
Quotes and line items
Tickets
Standard and custom HubSpot properties
Reporting dates and currencies
This provides the foundation for the KPIs in this guide, while Power BI remains the layer where organisation-specific measures, targets, filters and dashboards are created.
Connectorly does not decide what a company’s sales KPIs should mean. The organisation must still agree on its definitions, exclusions, currencies and reporting periods. However, a prepared and regularly updated data source reduces the recurring technical work required to make that reporting possible.
Learn more about the Connectorly HubSpot and Power BI integration.
Final Thoughts
The best HubSpot sales KPIs in Power BI are not necessarily the most complicated measures. They are the ones that use clear definitions, answer genuine business questions and help users take action.
Begin with a focused set of measures covering pipeline, outcomes and efficiency. Open pipeline and weighted pipeline describe potential revenue, while won revenue and win rate show completed results. Average deal value and sales-cycle length provide important context, and exception measures reveal whether the underlying CRM data can be trusted.
Validate each KPI against individual HubSpot records before relying on headline totals. Document the date field, currency, filters and exclusions used in every calculation so that results remain understandable as the report develops.
Once the foundation is dependable, you can extend the model with sales targets, activities, products, marketing information and finance data. This turns a basic sales dashboard into a broader reporting environment without losing clarity or control.
Frequently Asked Questions
What are the most important HubSpot sales KPIs?
The most useful HubSpot sales KPIs commonly include open pipeline value, weighted pipeline, won revenue, won deals, win rate, average won deal value, average sales-cycle length and pipeline coverage. The right selection depends on the organisation’s sales process and reporting goals.
How do you calculate sales win rate in Power BI?
Divide the number of won deals by the total number of closed deals, including both won and lost opportunities. Both measures must use the same filters, date basis and reporting period. Format the result as a percentage.
What is the difference between open and weighted pipeline?
Open pipeline is the full value of active opportunities. Weighted pipeline adjusts each deal according to its closing probability, producing a more cautious estimate. Neither measure represents guaranteed future revenue.
Why do HubSpot and Power BI show different sales KPI values?
Differences commonly result from refresh timing, date fields, pipeline filters, archived records, deal stages, currency conversion or different amount properties. Compare a small group of Deal IDs using identical filters before investigating only the overall total.
Can HubSpot sales KPIs be compared with targets in Power BI?
Yes. Import sales targets from Excel, a database or another planning source, then relate them to the appropriate dates, owners or teams. Power BI can compare targets with won revenue, weighted pipeline and open pipeline to calculate attainment, gaps and pipeline coverage.