One of the questions we hear from customers is:
“Why would I connect HubSpot to Power BI when HubSpot already has reporting?”
It is a fair question.
HubSpot includes useful built-in reports and dashboards for day-to-day CRM, sales, marketing, and service activity. For many teams, that is enough when reporting requirements are simple.
But as businesses grow, reporting usually becomes more complex. Teams want to combine HubSpot with finance data, track performance over time, build executive dashboards, and calculate metrics that go beyond standard CRM reports.
This is where Power BI becomes a valuable addition to HubSpot.
In this article, we will look at why HubSpot and Power BI work so well together, where HubSpot reporting can become limited, and how businesses can use Power BI to build more complete reporting.
Does HubSpot Have Built-In Reporting?
Yes, HubSpot includes built-in reporting and dashboards.
Teams can report on areas such as contacts, companies, deals, sales activities, marketing campaigns, forms, emails, tickets, and pipeline performance.
For operational reporting, this is often very useful.
Sales teams can monitor deals, marketers can review campaign activity, and managers can track basic performance from inside HubSpot.
However, HubSpot is still primarily a CRM platform. When reporting needs move beyond CRM activity, many teams start looking for a more flexible reporting layer.
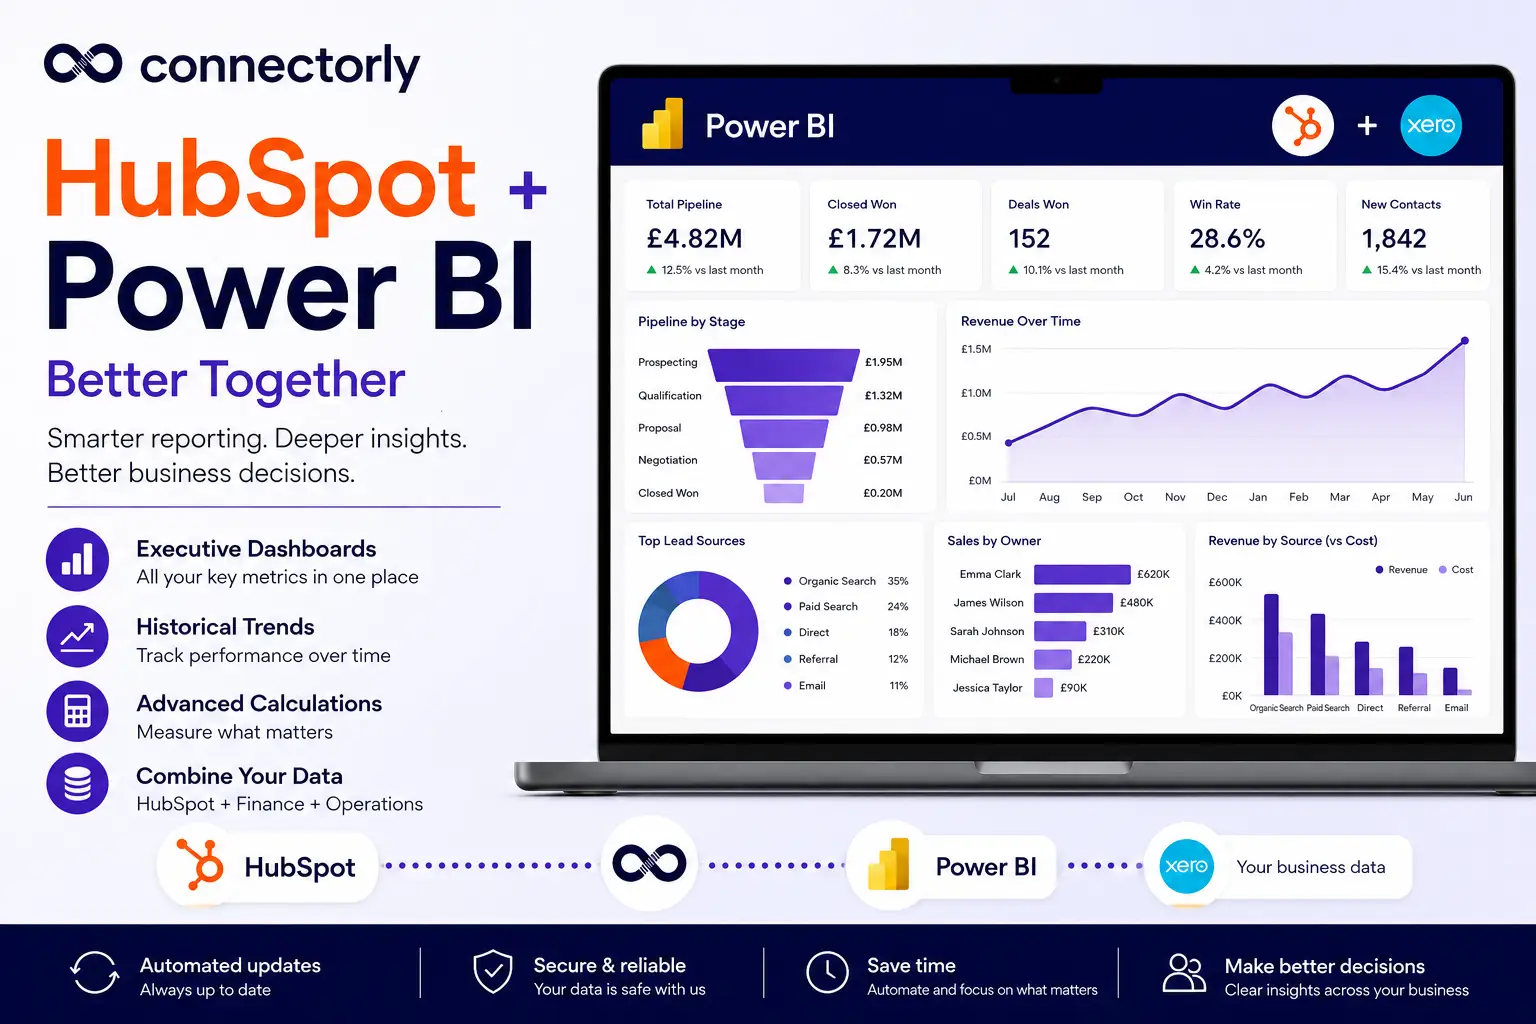
Why Connect HubSpot to Power BI?
The main reason to connect HubSpot to Power BI is flexibility.
Power BI allows businesses to combine HubSpot data with other systems, create custom calculations, build historical reporting, and design dashboards around the way the business actually works.
For example, a sales manager may want to see HubSpot pipeline data. A finance director may want to compare that pipeline with invoiced revenue from Xero. A COO may want to see sales performance, customer growth, service activity, and financial results in one place.
That type of reporting is much easier when HubSpot data is available inside Power BI.
1. HubSpot Reporting Focuses on CRM Data
HubSpot reporting is strongest when the data lives inside HubSpot.
That makes sense. HubSpot is designed to manage CRM, sales, marketing, and customer service data.
But most businesses do not run on HubSpot alone.
They may also use:
- Xero for accounting
- Excel for budgets and targets
- SQL databases for operational data
- Other internal systems for customer or product information
Power BI allows these sources to be brought together into one reporting model.
This means teams can analyse HubSpot deals alongside invoiced revenue, marketing leads alongside customer value, or sales activity alongside financial performance.
2. Power BI Makes Historical Reporting Easier
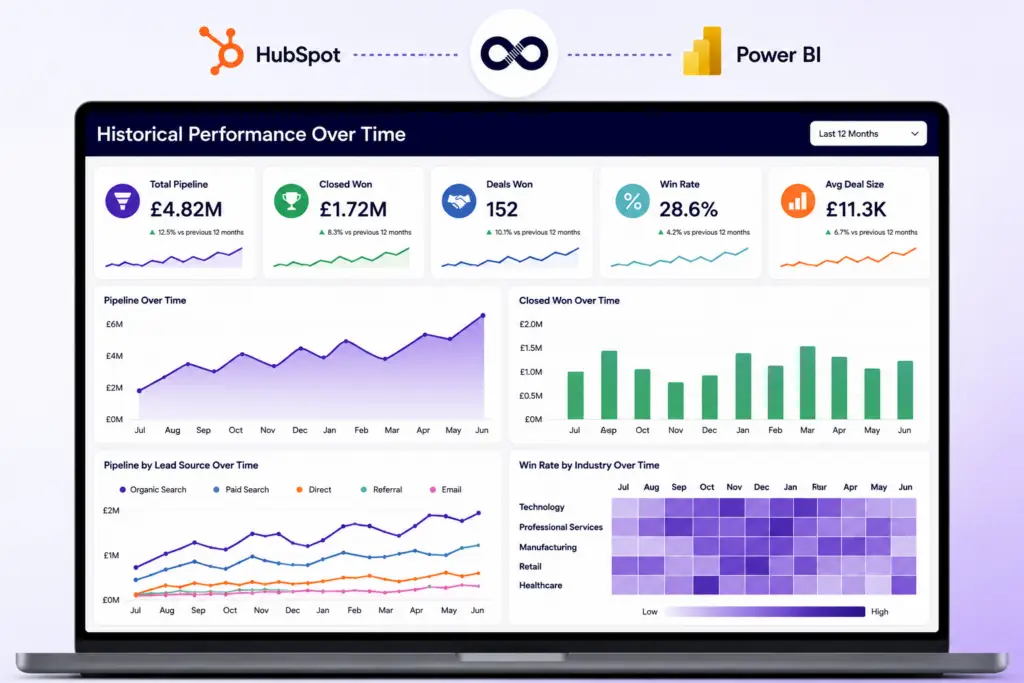
Historical reporting is one of the most common reasons businesses move beyond standard CRM dashboards.
Teams often want to answer questions such as:
- How has our pipeline changed over time?
- Which lead sources generate the best opportunities?
- Which industries convert best?
- How has deal velocity changed across the year?
- Which sales activities are linked to closed revenue?
Power BI is well-suited to trend reporting because it allows users to build reports across months, quarters, and years.
This is useful for leadership teams, finance teams, sales managers, and marketing teams that need to understand not only what is happening now, but how performance is changing over time.
3. Advanced Calculations Are Easier in Power BI
Most reporting starts with simple numbers.
For example:
- Number of deals
- Total pipeline value
- Closed revenue
- New contacts
- Sales activities
Over time, teams usually need more advanced calculations.
Examples include:
- Win rate by sales representative
- Average deal size
- Lead-to-customer conversion rate
- Pipeline velocity
- Sales cycle duration
- Revenue by lead source
- Marketing return on investment
- Customer acquisition cost
- Forecast versus actual revenue
Power BI gives teams more control over these calculations.
Instead of being restricted to standard report options, businesses can create metrics that match their own reporting definitions.
4. Executive Dashboards Can Combine Sales, Marketing, and Finance
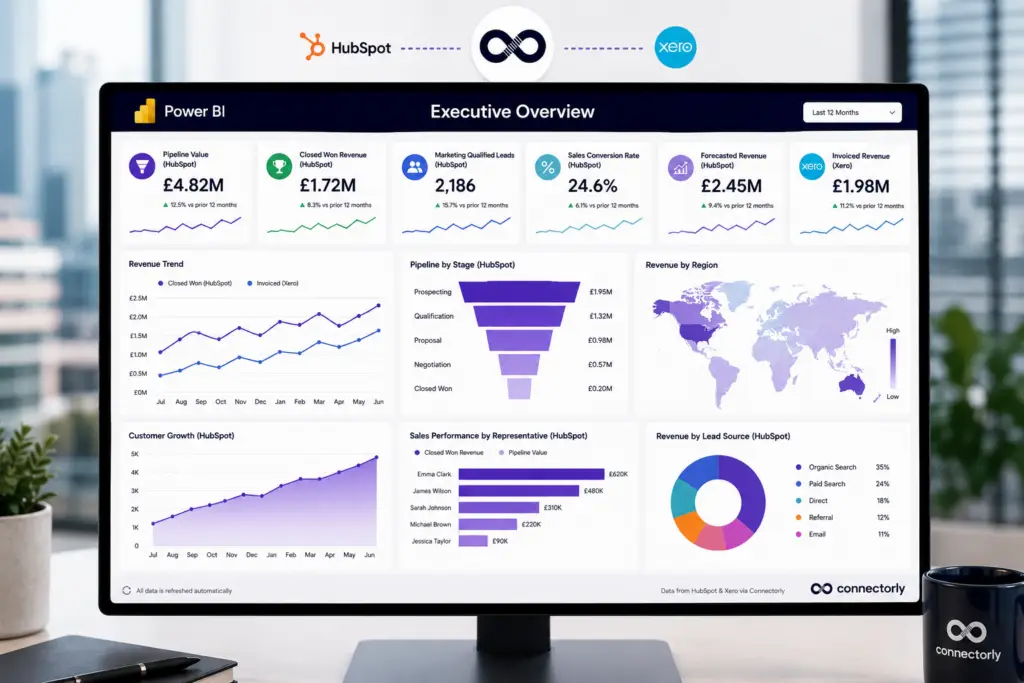
Executives usually do not want to open several different systems to understand business performance.
They need a clear dashboard that shows the most important numbers in one place.
A useful executive dashboard might include:
- HubSpot pipeline value
- Closed won revenue
- Marketing-qualified leads
- Sales conversion rates
- Forecasted revenue
- Invoiced revenue from Xero
- Customer growth
- Revenue by region
- Sales performance by representative
Power BI is useful here because it can combine HubSpot CRM data with data from other systems.
This gives leadership teams a broader view of performance without relying on manual spreadsheet exports.
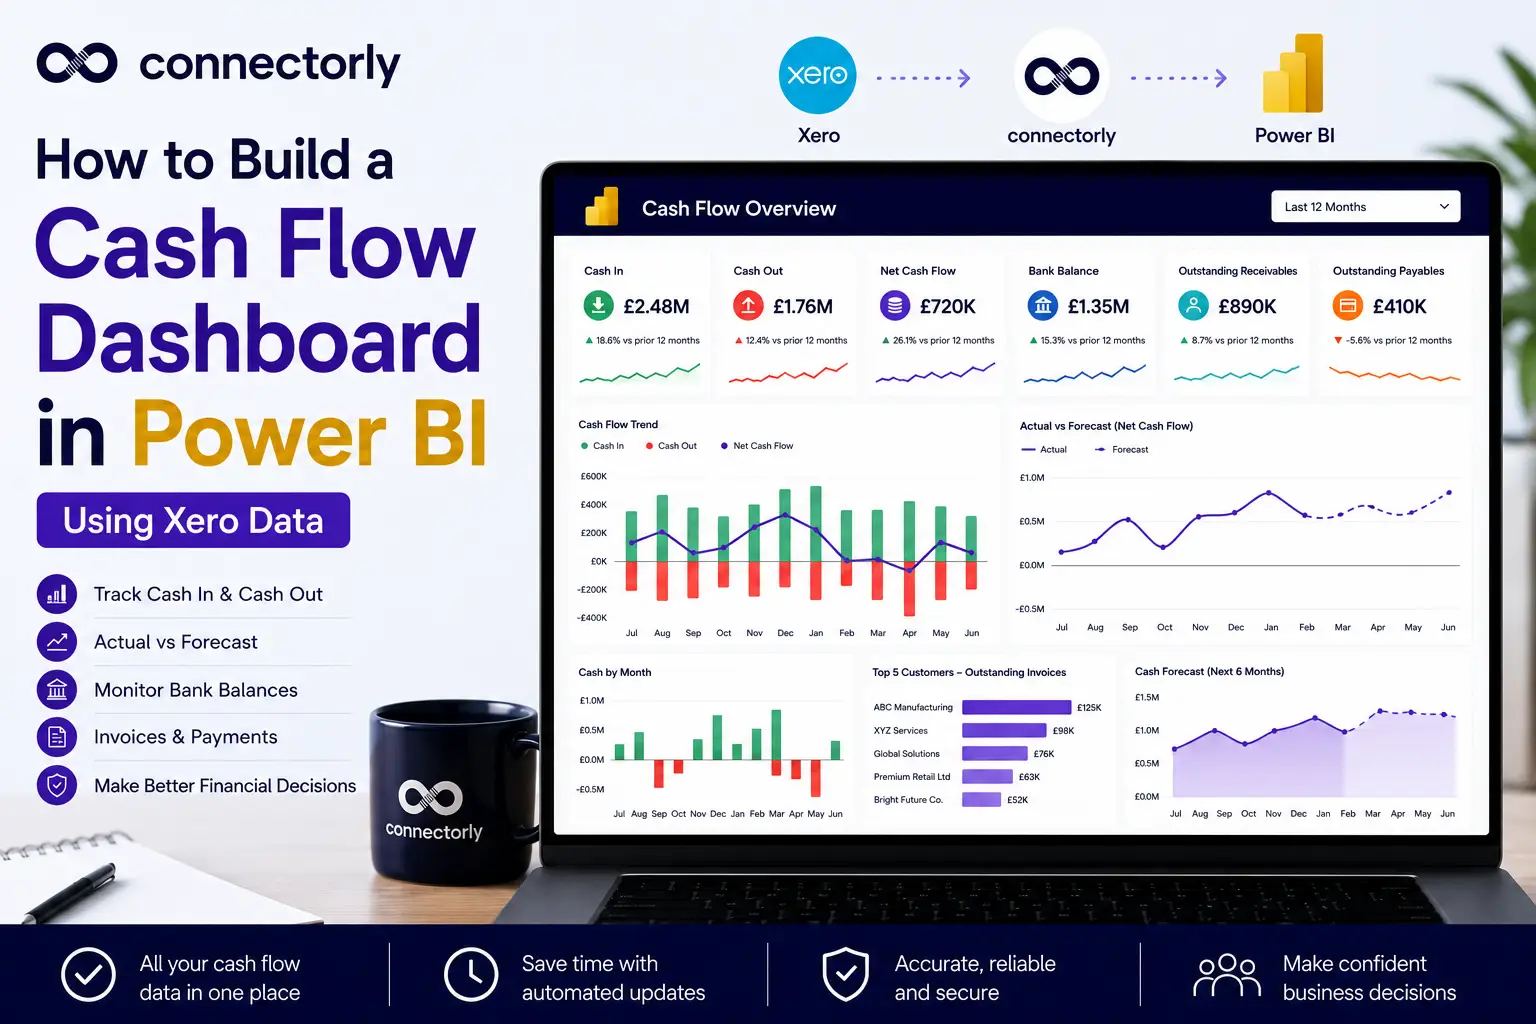
5. HubSpot and Xero Data Are Stronger Together
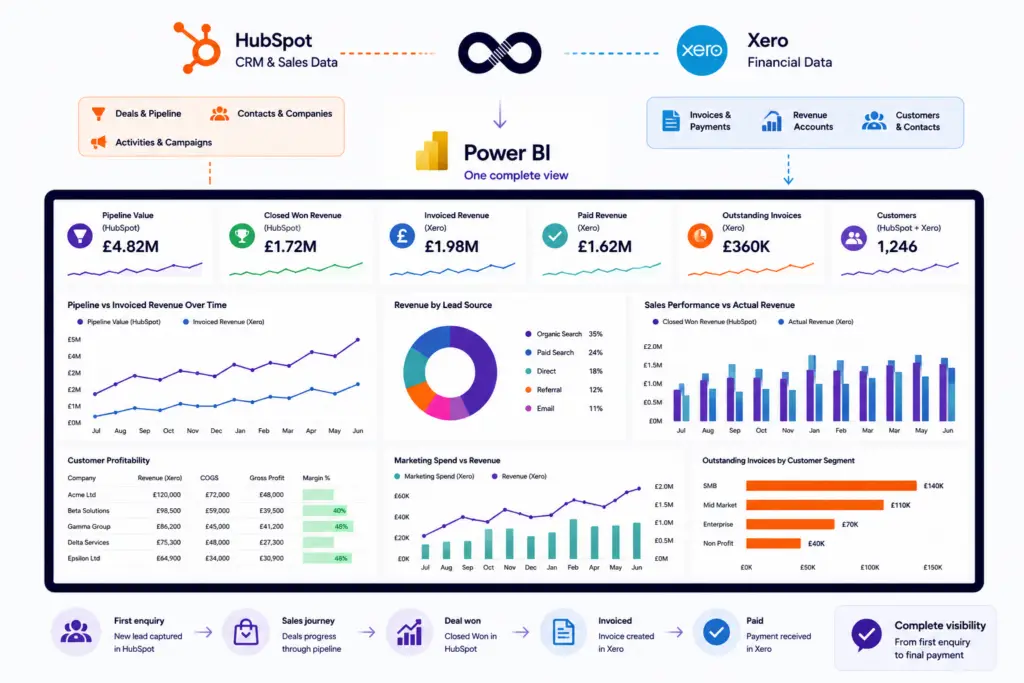
For many businesses, HubSpot shows the sales journey while Xero shows the financial outcome.
Looking at those systems separately can leave gaps.
For example, HubSpot may show that a deal was closed, but Xero shows whether the customer has been invoiced and paid.
By combining HubSpot and Xero data in Power BI, businesses can analyse:
- Pipeline versus invoiced revenue
- Revenue by lead source
- Customer profitability
- Sales performance against actual revenue
- Marketing activity against financial results
- Outstanding invoices by customer segment
This gives a more complete view of performance from first enquiry through to payment.
How Connectorly Connects HubSpot and Power BI
Connectorly for HubSpot & Power BI helps businesses bring HubSpot data into Microsoft Power BI for reporting and dashboard creation.
Instead of relying on manual exports, teams can use Connectorly to access HubSpot data in Power BI and build reports around their own requirements.
Learn more here:
HubSpot and Power BI Connector
If you want the setup steps, use this guide:
You can also read more about bringing HubSpot data into Power BI Desktop here:
What HubSpot Data Can You Report on in Power BI?
With Connectorly, businesses can report on key HubSpot data in Power BI.
This can include areas such as contacts, companies, deals, owners, tickets, pipelines, stages, activities, and custom properties, depending on the data available in the HubSpot account.
Connectorly also provides a HubSpot data model overview here:
https://help.connectorly.io/en/articles/10261035-the-connectorly-hubspot-data-model
This is useful for Power BI developers who want to understand how HubSpot data is structured before building reports.
Can You Start with a Free HubSpot Power BI Template?
Yes.
Connectorly provides free Power BI templates for HubSpot.
These templates are designed to give users a faster starting point for reporting on HubSpot CRM data in Power BI.
You can find the HubSpot templates here:
Easy Power BI Templates for HubSpot
Templates are useful if you do not want to build every report page from scratch. You can use them as a starting point, then customise the dashboards to match your own sales process, pipeline stages, and reporting requirements.
Can You Combine HubSpot with Other Business Systems?
Yes.
One of the main benefits of Power BI is that it can combine data from multiple systems.
Connectorly also supports other integrations, including:
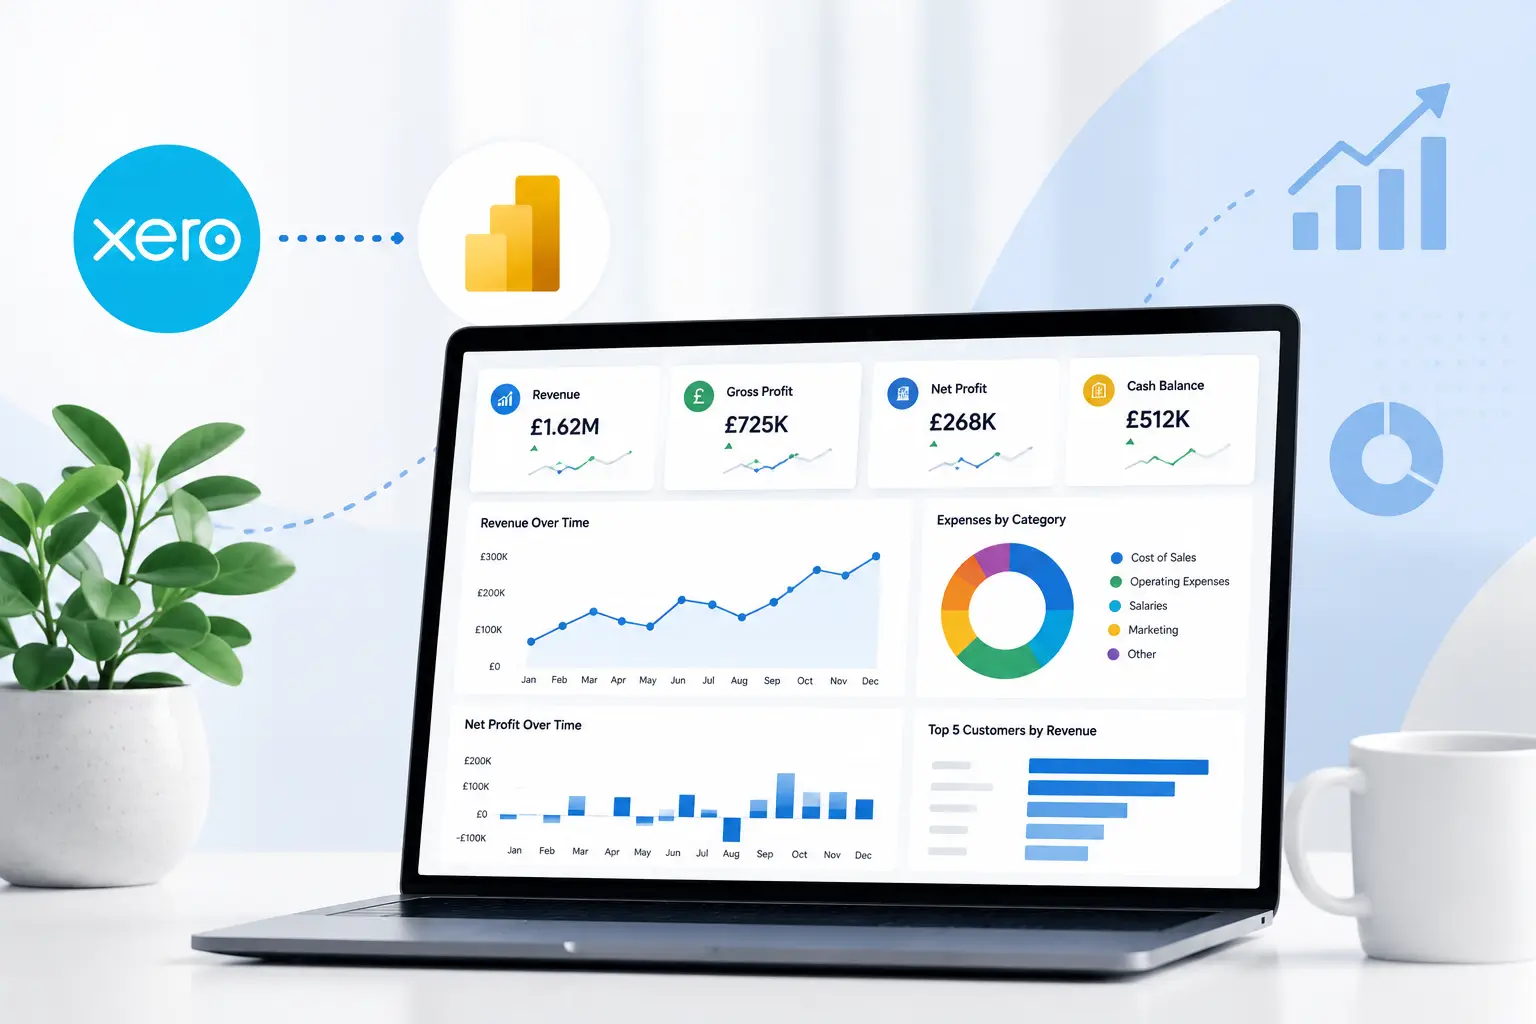
Connectorly for Xero & Power BI:
Xero and Power BI Connector
This is helpful for businesses that want to connect CRM, finance and sales data into one reporting environment.
Is Power BI Difficult to Use with HubSpot?
Power BI can look unfamiliar at first, especially for users who are used to working only inside HubSpot.
However, many users start with simple reports and build from there.
A good starting point is usually:
- Connect HubSpot data
- Open a template
- Review the existing pages
- Adjust filters and visuals
- Add the business metrics that matter most
If your team is new to Power BI, Connectorly’s guides, templates, and onboarding support can help you get started without having to build everything from a blank page.
Final Thoughts
HubSpot provides useful reporting for CRM, sales, marketing, and service activities.
Power BI offers flexibility for businesses that need deeper reporting, historical analysis, advanced calculations, and dashboards that integrate multiple systems.
Used together, HubSpot and Power BI can help businesses move from basic CRM reporting to clearer management reporting across sales, marketing, finance, and operations.
If your team is already using HubSpot and wants more flexible dashboards, connecting HubSpot to Power BI is a practical next step.
Recommended Reading
Connectorly for HubSpot & Power BI
https://connectorly.io/integrations/hubspot-power-bi/
Connect HubSpot to Power BI
https://connectorly.io/blog/connect-hubspot-to-power-bi/
Setup Connectorly for HubSpot and Microsoft Power BI
https://help.connectorly.io/en/articles/10431130-setup-connectorly-for-hubspot-and-microsoft-power-bi
How to Bring HubSpot Data into Microsoft Power BI Desktop
https://help.connectorly.io/en/articles/10430909-how-to-bring-hubspot-data-into-microsoft-power-bi-desktop
The Connectorly HubSpot Data Model
https://help.connectorly.io/en/articles/10261035-the-connectorly-hubspot-data-model
Free HubSpot Power BI Templates
https://connectorly.io/data-templates/easy-power-bi-templates-for-hubspot/
Connectorly for Xero & Power BI
https://connectorly.io/integrations/xero-power-bi/
Connectorly for Dynamics 365 & Xero
https://connectorly.io/integrations/dynamics-365-xero/
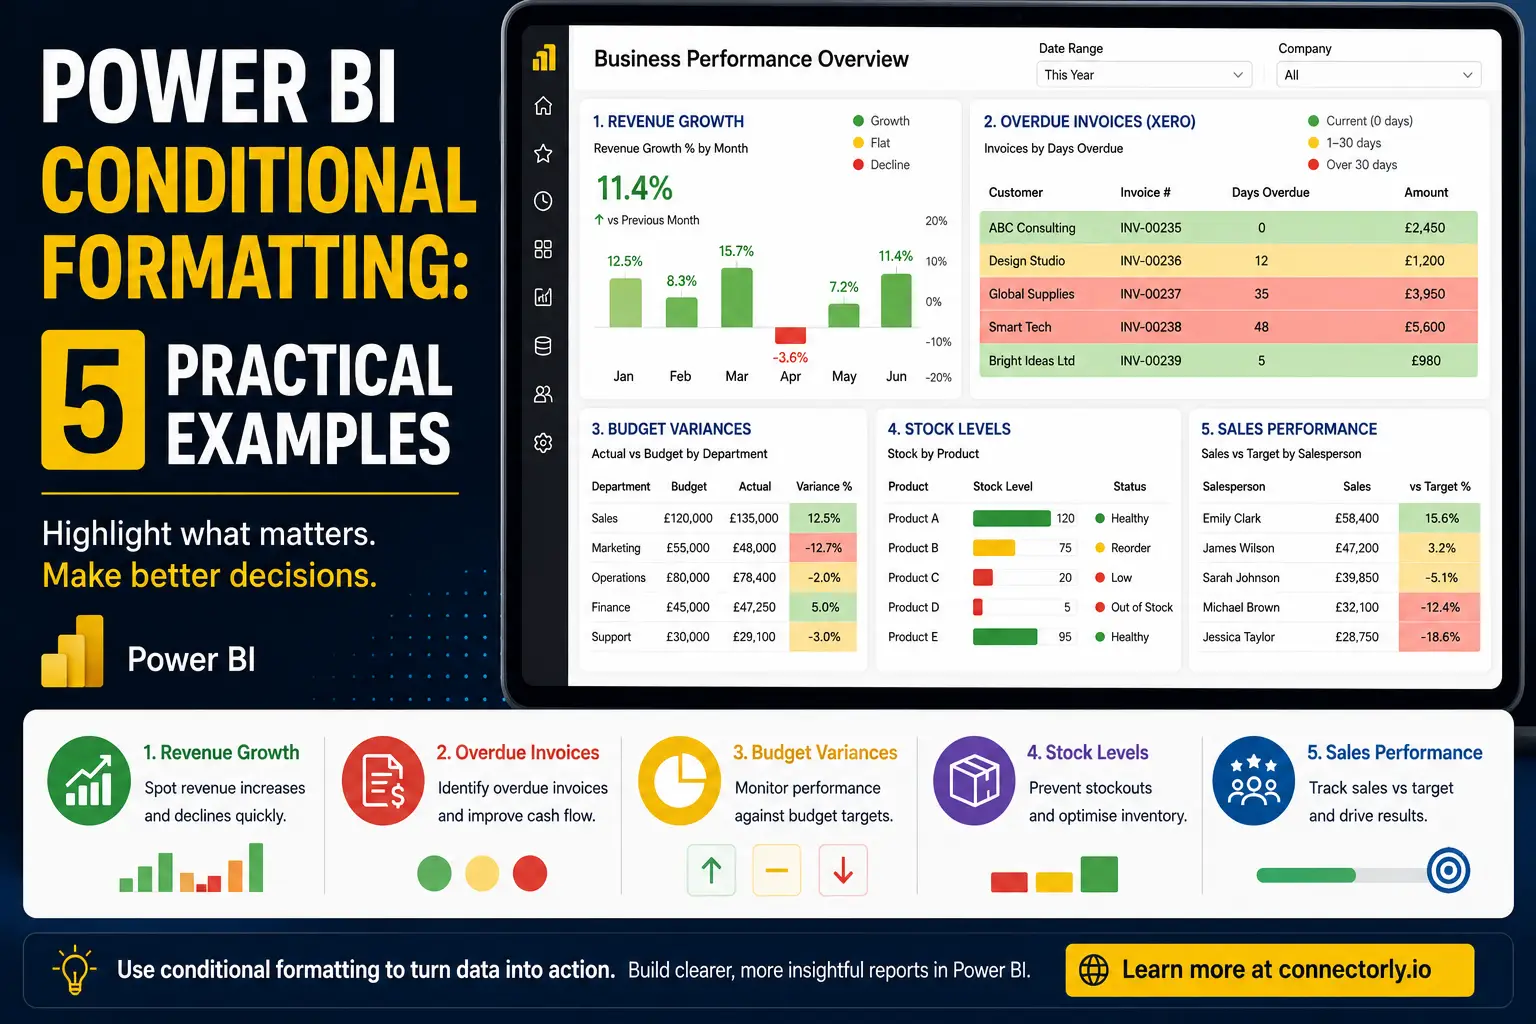
Power BI Conditional Formatting: 5 Practical Examples
https://connectorly.io/blog/power-bi-conditional-formatting-examples/
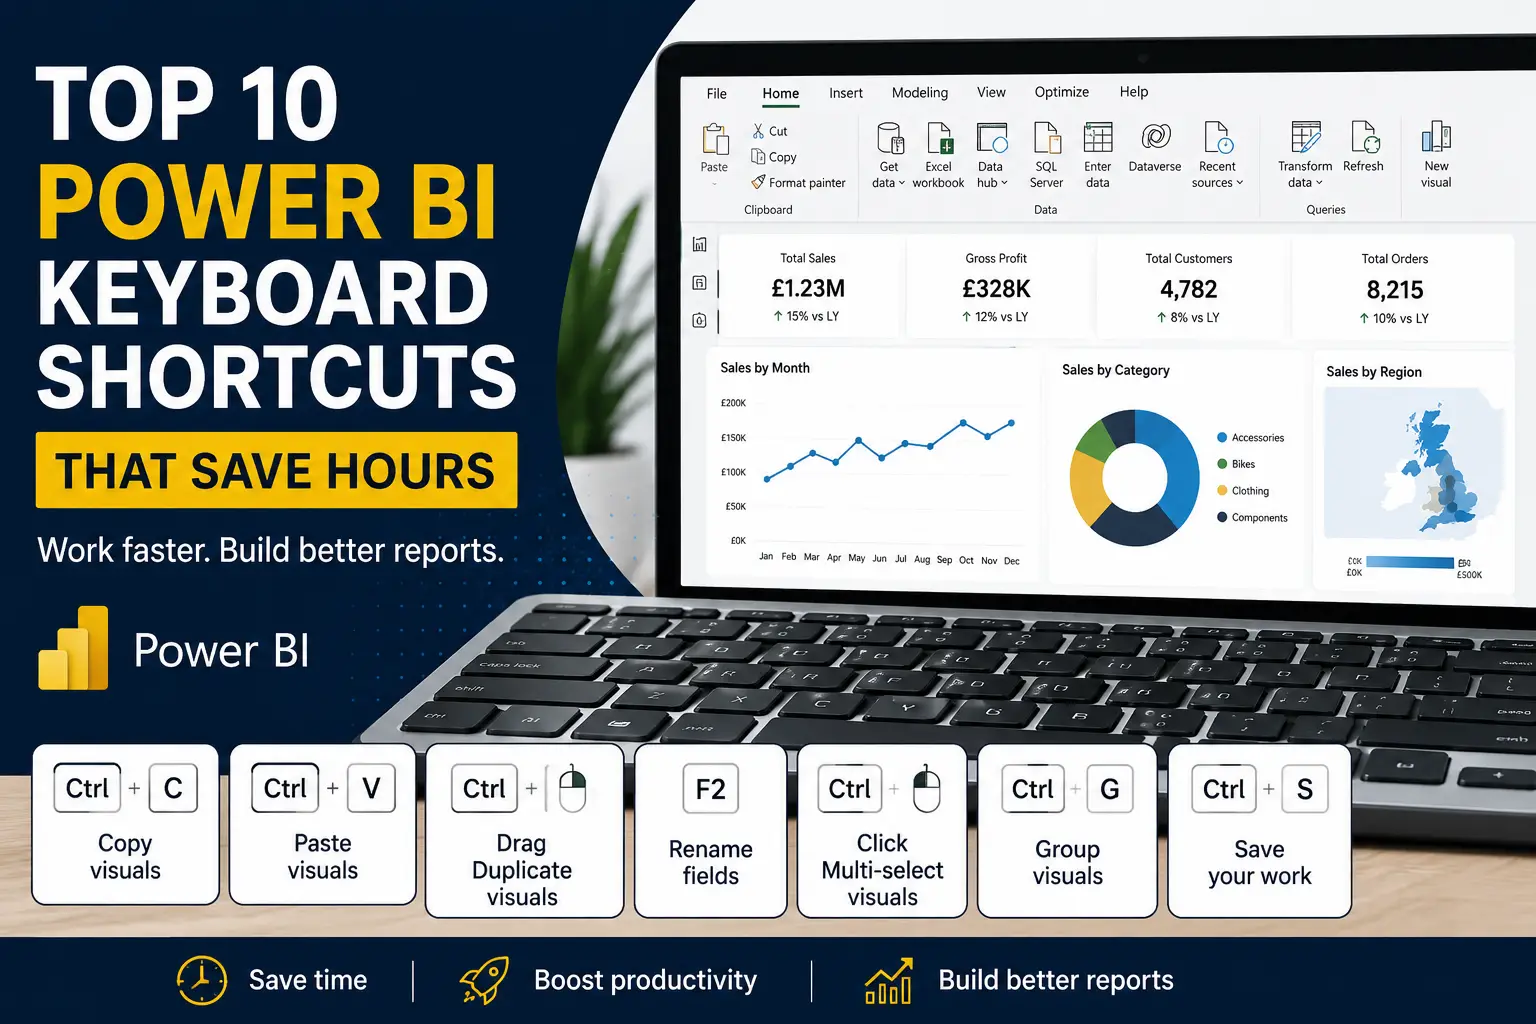
Top 10 Power BI Keyboard Shortcuts That Save Hours
https://connectorly.io/blog/top-10-power-bi-keyboard-shortcuts/
Frequently Asked Questions
Does HubSpot integrate with Power BI?
HubSpot data can be used in Power BI through an integration or connector. Connectorly for HubSpot & Power BI helps businesses bring HubSpot CRM data into Power BI so they can build reports and dashboards using HubSpot data.
Why should I connect HubSpot to Power BI?
Connecting HubSpot to Power BI gives you more flexibility for reporting. It allows you to combine HubSpot with other systems, build historical reports, create advanced calculations, and design executive dashboards around your own business KPIs.
What are the limitations of HubSpot reporting?
HubSpot reporting is useful for CRM, sales, marketing, and service activities. However, businesses may need Power BI when they want to combine HubSpot with other systems, build more advanced calculations, analyse longer-term trends, or create highly customised dashboards.
Can I combine HubSpot and Xero data in Power BI?
Yes. Power BI can combine data from different systems, including HubSpot and Xero. This allows businesses to compare CRM activity, sales pipeline, invoices, payments, revenue, and customer performance in one reporting environment.
What dashboards can I build with HubSpot data in Power BI?
Common HubSpot Power BI dashboards include sales pipeline dashboards, deal conversion reports, sales representative performance reports, marketing source reports, customer growth dashboards, executive dashboards, and revenue forecasting reports.
Is Power BI better than HubSpot reporting?
Power BI is not a direct replacement for HubSpot reporting in every situation. HubSpot reporting is useful for day-to-day CRM activity. Power BI is better suited when you need more flexible dashboards, advanced calculations, multi-system reporting, and historical analysis.
Can I use a template to report on HubSpot data in Power BI?
Yes. Connectorly provides free HubSpot Power BI templates that can be used as a starting point for reporting on HubSpot CRM data. These templates can be customised to match your own sales process and reporting requirements.
Do I need to be a Power BI expert to start?
No. You can start with a template and basic reports, then customise them over time. If your team is new to Power BI, Connectorly provides guides, documentation, and onboarding support to help you get started.