Understanding customer payment behaviour can tell you much more than simply knowing how much your customers currently owe. An outstanding balance only tells you part of the story.
Two customers might each owe £20,000, but their payment behaviour could be very different. One may consistently pay invoices on time, while the other regularly pays several weeks late. Looking only at the current outstanding balance does not reveal that difference.
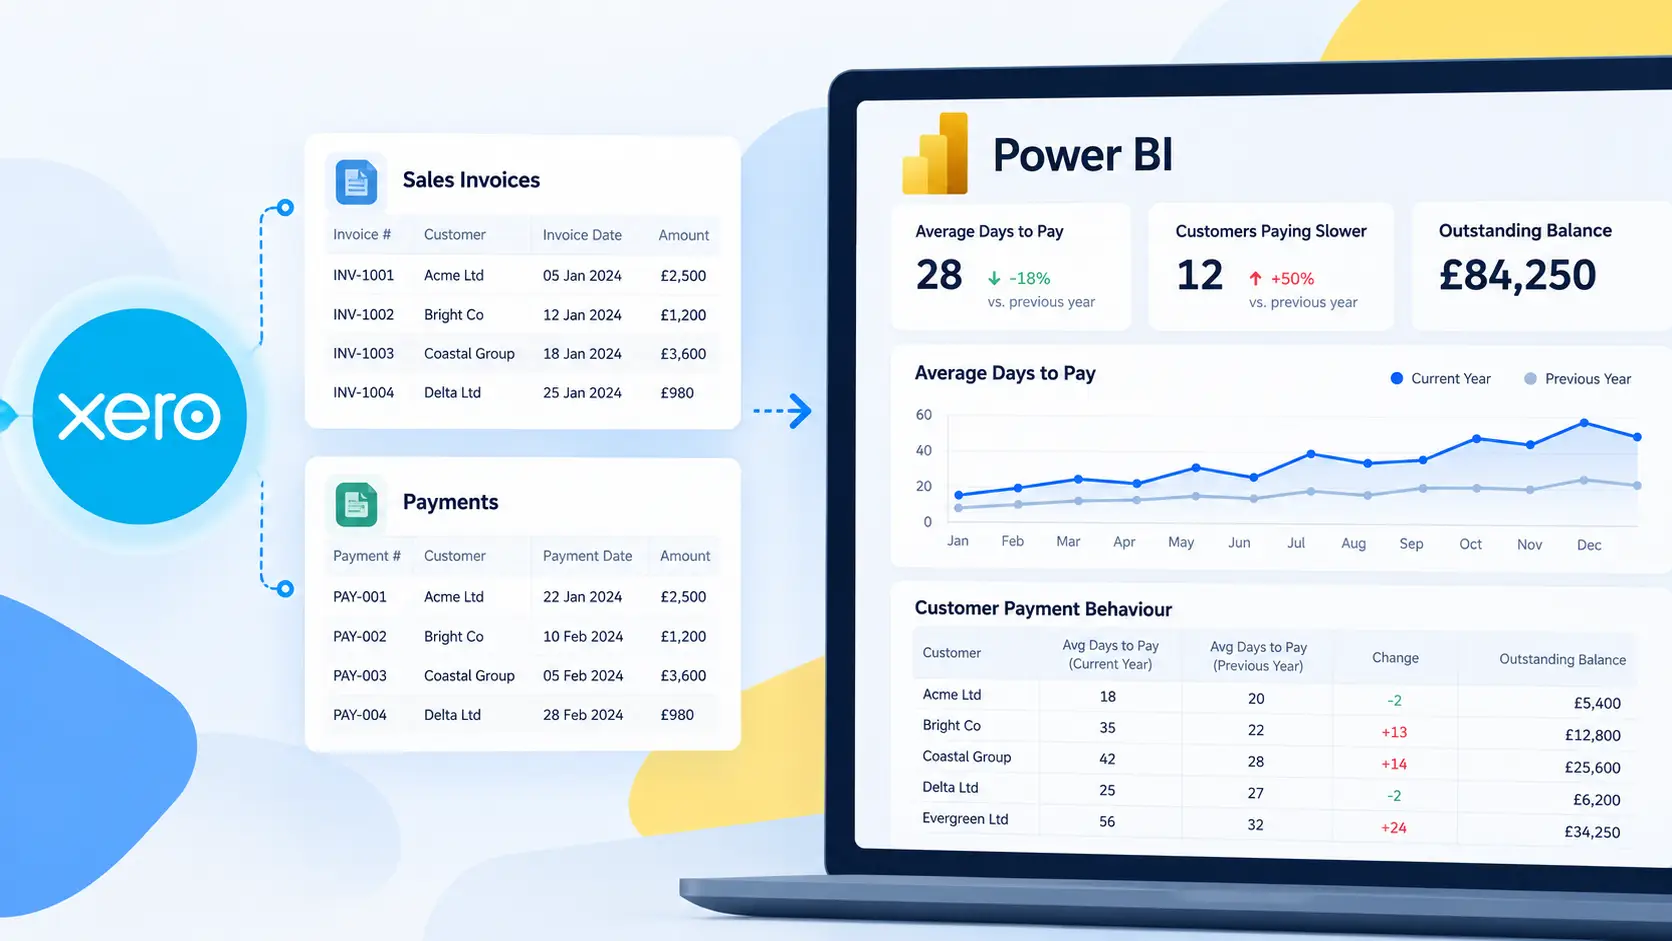
Your historical Xero data can provide much more insight into how customers actually pay. By analysing invoice and payment history in Power BI, you can identify customers who tend to pay quickly, those who consistently take longer to pay, and customers whose payment behaviour is improving or getting worse over time.
This can help finance teams focus their attention where it matters, understand potential cash-flow risks and make more informed decisions when reviewing outstanding receivables.
In this guide, we’ll look at how to analyse customer payment behaviour using Xero data in Power BI, which metrics are useful, how to interpret them, and how payment history can provide additional context alongside your aged receivables reporting.
Why Customer Payment Behaviour Matters
Traditional receivables reporting focuses mainly on what customers owe and how long those balances have been outstanding. This is essential information, but it provides only a snapshot of the current position.
Payment behaviour adds another dimension by looking at how customers have actually paid their invoices over time.
For example, a customer with no overdue invoices today may still have a history of paying late. Another customer may currently have a large outstanding balance but consistently pays within the agreed payment terms.
Understanding these patterns can help you distinguish between a large balance that is part of normal customer behaviour and a change that may require closer attention.
It can also help answer practical questions such as:
• Which customers typically take the longest to pay?
• Which customers consistently pay on time or early?
• Is a customer’s payment behaviour improving or deteriorating?
• Has a normally reliable customer recently started taking longer to pay?
• Which customers may require closer attention when reviewing expected cash collection?
Instead of looking only at today’s outstanding invoices, payment behaviour gives finance teams additional historical context when reviewing receivables and planning cash flow.
What Can You Learn From Xero Payment History?
Xero contains the transaction history needed to understand how customers have paid you in the past. When invoice and payment data is brought into Power BI, you can analyse those patterns across customers and over different periods.
One of the most useful questions is how long customers typically take to pay. However, the real value comes from looking beyond a single average.
For example, you can investigate:
• How long each customer typically takes to pay an invoice.
• Whether customers are generally paying within their agreed payment terms.
• Which customers regularly pay later than others.
• Whether a customer’s payment behaviour has changed over time.
• Whether customers who previously paid reliably are beginning to take longer to pay.
• How payment behaviour differs between customers, customer groups or reporting periods.
Historical payment data can therefore provide useful context when reviewing current receivables. A customer who normally pays within 20 days but has several invoices outstanding for 45 days may deserve more attention than a customer whose normal payment cycle is considerably longer.
The important point is that payment history should provide context rather than replace your aged receivables reporting. Used together, the two views can give you a much clearer picture of both your current position and the behaviour behind it.
The Xero Data You Need for Payment Behaviour Analysis
To analyse customer payment behaviour, you need more than a list of outstanding invoices. You need to connect each customer with their historical invoices and the payments made against those invoices.
The key information includes:
• Customer or contact information, so transactions can be analysed for each customer.
• Invoice dates, which show when invoices were raised.
• Due dates, which allow you to determine whether payments were made within the agreed payment terms.
• Payment dates, which show when customers actually paid.
• Invoice and payment amounts, particularly where invoices are paid in more than one payment.
• A reliable customer identifier, so transactions can be associated with the correct customer even if a contact name changes.
Together, these data points allow Power BI to analyse both how long customers take to pay and whether they are paying before or after their invoice due dates.
It is important to distinguish between these two measures. A customer who pays an invoice 30 days after the invoice date is not necessarily 30 days late. If the invoice had 30-day payment terms, the customer may have paid exactly on time.
Connectorly brings Xero data into a reporting-ready database that can be used from Power BI. It also provides calculated customer payment metrics that can make payment behaviour easier to analyse without having to recreate every calculation from the raw Xero data.
Average Days to Pay: A Simple but Useful Customer Metric
One of the simplest ways to understand customer payment behaviour is to measure how long customers typically take to pay their invoices.
Average Days to Pay gives you a historical view of the time between issuing invoices and receiving payment. At customer level, this can quickly highlight differences in payment behaviour that are difficult to see from outstanding balances alone.
For example, two customers may currently have similar outstanding balances, but one may typically pay within 20 days while the other usually takes 45 days. That historical context can help you interpret their current outstanding invoices more effectively.
However, Average Days to Pay should not be viewed in isolation.
A higher number does not automatically mean that a customer is paying late. Payment terms matter. A customer who normally pays after 30 days may be paying exactly as agreed if their invoices have 30-day terms.
The number of historical transactions also matters. An average based on many paid invoices is generally more representative of normal behaviour than an average based on only one or two transactions.
This is why Average Days to Pay becomes more useful when you combine it with invoice due dates, current outstanding balances and changes in payment behaviour over time.
Rather than asking only “How long does this customer normally take to pay?”, the more useful question is often:
“Is this customer paying differently from how they normally do?”
Compare Customer Payment Behaviour Over Time
A customer’s average payment time is useful, but the direction in which that behaviour is moving can be even more important.
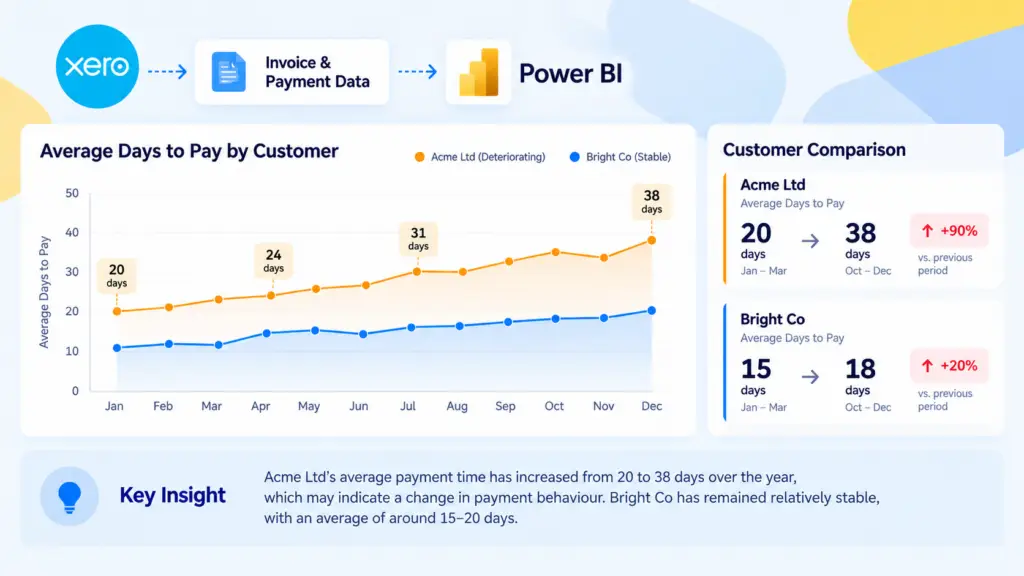
Consider a customer who historically paid invoices within 25 days. If that average has gradually increased to 35 or 40 days, the change may be worth investigating even if the customer does not currently have a large overdue balance.
The opposite can also happen. A customer who previously took 45 days to pay may now regularly pay within 30 days, indicating an improvement in payment behaviour.
Power BI makes it possible to compare these patterns across different reporting periods. For example, you can compare a customer’s payment behaviour in the current financial year with the previous financial year and identify where the time taken to pay has increased or decreased.
This allows you to look for:
• Customers whose average payment time is increasing.
• Customers whose payment behaviour is improving.
• Significant changes compared with the previous financial year.
• Customers whose recent payment behaviour differs from their longer-term history.
Looking at the change as well as the absolute number is important. A customer who normally takes 40 days to pay and continues to take around 40 days is behaving consistently. A customer who has moved from 20 days to 35 days may represent a more meaningful change, even though their current average is still lower.
This type of trend analysis turns payment history into an early indicator that finance teams can investigate alongside outstanding invoices and other customer information.
How to Build a Customer Payment Behaviour Report in Power BI
A useful customer payment behaviour report does not need to be complicated. The aim is to make it easy to compare customers, identify changes in behaviour and then investigate the customers that stand out.
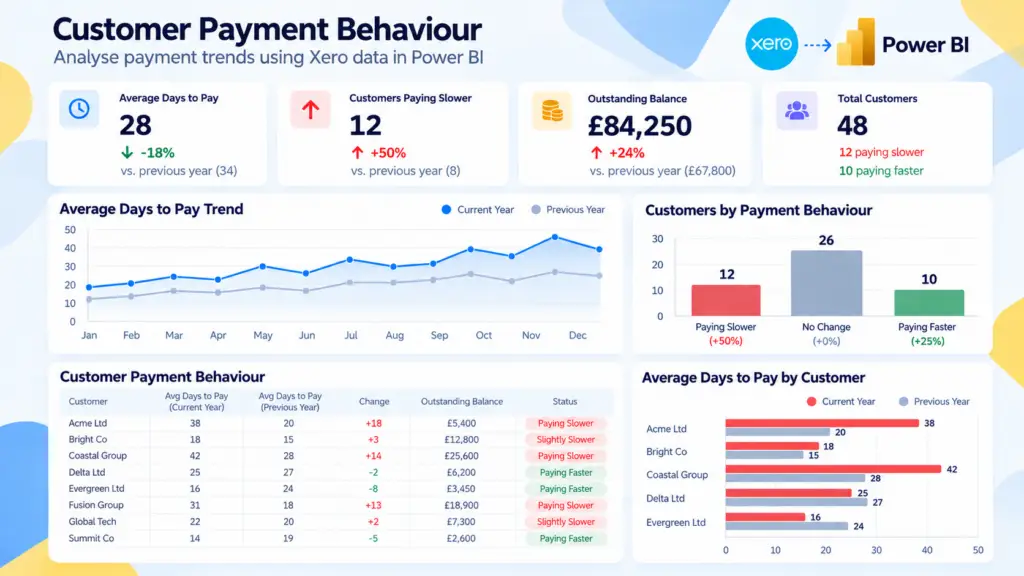
A good starting point is a customer-level table containing metrics such as:
• Customer name.
• Average Days to Pay.
• Payment behaviour for the current financial year.
• Payment behaviour for the previous financial year.
• The change in payment behaviour between the two periods.
• Current outstanding balance.
You can then use conditional formatting to make significant changes easier to identify. For example, customers whose payment time has increased could be highlighted so that finance teams can quickly see where payment behaviour may be deteriorating.
Summary visuals can provide additional context. You might show the overall Average Days to Pay, the number of customers whose payment behaviour has worsened, or a chart showing how payment times have changed over recent periods.
The report should also allow users to move from the customer-level summary into the underlying invoice detail. If a customer’s payment behaviour has changed significantly, being able to review their recent invoices and payments can help explain what is driving the change.
The objective is not simply to create another dashboard full of metrics. It is to make unusual or changing customer behaviour easy to identify and investigate.
How to Identify Customers Whose Payment Behaviour Is Getting Worse
Once you can compare payment behaviour over time, the next step is to identify the customers whose behaviour may require attention.
A customer does not necessarily become a concern simply because they take longer than average to pay. Their normal payment cycle, agreed payment terms and previous behaviour all provide important context.
Instead, look for changes that are unusual for that particular customer.
For example, you may want to investigate customers where:
• Average payment time has increased significantly compared with the previous financial year.
• Recent invoices are taking longer to pay than the customer’s historical pattern.
• A customer who normally pays reliably has started paying after the due date.
• Outstanding invoices are already older than the customer’s normal payment cycle.
• The customer has both a significant outstanding balance and deteriorating payment behaviour.
These indicators can help finance teams prioritise where to look first rather than treating every outstanding invoice in the same way.
They should not automatically be interpreted as evidence that a customer is experiencing financial difficulty. Payment behaviour can change for many reasons, including invoice disputes, changes to payment terms, administrative delays or individual invoices that distort the average.
The purpose of the analysis is therefore to identify exceptions that deserve investigation.
Power BI can make these exceptions easier to spot by combining current receivables with historical payment behaviour in the same report. Finance teams can then move from identifying a change to reviewing the invoices and transactions behind it.
Payment Behaviour vs Aged Receivables: What's the Difference?
Payment behaviour analysis and aged receivables reporting answer two different questions.
An aged receivables report focuses on your current position. It shows which invoices remain unpaid, how much each customer owes and how long those balances have been outstanding.
Payment behaviour analysis looks backwards at how customers have historically paid their invoices. It helps you understand what is normal for each customer and whether that behaviour is changing.
For example, an aged receivables report might show that a customer has £15,000 outstanding. Payment behaviour adds context by showing whether that customer normally pays within 20 days, 40 days or considerably later.
Neither view replaces the other. They become more useful when used together.
Aged receivables helps you answer:
“What do our customers owe us right now?”
Payment behaviour helps you answer:
“Is the way this customer is paying normal for them?”
Combining the two can help finance teams prioritise their attention based not only on the size and age of an outstanding balance, but also on how that position compares with the customer’s previous behaviour.
If you want to build the current-position side of this analysis, our guide to building an Aged Receivables Dashboard in Power BI using Xero data explains the process in more detail.
How Connectorly Uses Payment Behaviour for Cash-Flow Forecasting
Historical payment behaviour can also be useful when looking forward rather than only analysing the past.
Connectorly uses customer payment history when generating forecast data from Xero. For unpaid sales invoices, historical payment behaviour can help estimate when payment is likely to be received.
This provides a more realistic view than assuming that every customer will pay on the invoice due date. A customer who historically takes longer to pay may have a different expected payment pattern from a customer who consistently pays promptly.
Payment behaviour therefore has two useful roles in reporting. It can help finance teams understand how customers have paid in the past, while also providing additional information that can help estimate future cash collection.
If you would like to understand more about the forecasting process, our guide to how Connectorly generates forecast data explains the approach in more detail.
Common Mistakes When Analysing Customer Payment Behaviour
Payment behaviour metrics can be useful, but they need to be interpreted carefully. A simple average without the right context can sometimes give a misleading picture.
Here are some common mistakes to avoid:
• Confusing Days to Pay with Days Late. The time between the invoice date and payment date is not the same as the number of days a payment was overdue. Always consider the invoice due date and agreed payment terms.
• Relying on too few transactions. A customer with only one or two paid invoices does not provide much historical data, so their average may not represent a reliable long-term pattern.
• Looking only at an all-time average. A long-term average can hide recent changes. Comparing different periods can make deteriorating or improving payment behaviour easier to identify.
• Ignoring partial payments. Customers may pay an invoice in several instalments, so payment behaviour calculations need to account for how those payments relate to the invoice.
• Treating every slow-paying customer as a problem. Some customers may have longer agreed payment terms or established payment cycles. Compare their current behaviour with their own history rather than relying only on a single benchmark.
• Assuming a change in payment behaviour explains why it happened. The data can highlight an unusual pattern, but it may not reveal the reason. Invoice disputes, administrative delays, changed payment terms and other factors may require further investigation.
The most useful payment analysis therefore combines historical behaviour, current receivables and the underlying invoice detail rather than relying on one metric alone.
Frequently Asked Questions About Customer Payment Behaviour in Xero and Power BI
What is Average Days to Pay?
Average Days to Pay measures how long a customer typically takes to pay their invoices. It can help you understand normal payment behaviour for individual customers and compare how that behaviour changes over time.
Is Average Days to Pay the same as Days Late?
No. Days to Pay measures the time between an invoice being issued and payment being received. Days Late measures payment against the invoice due date. A customer who pays 30 days after the invoice date may still be paying on time if the invoice has 30-day payment terms.
Can Xero data be used to analyse customer payment behaviour in Power BI?
Yes. Xero invoice, payment and contact data can be used in Power BI to analyse historical customer payment patterns. This can include metrics such as payment times, changes between reporting periods and comparisons with current outstanding receivables.
Why should I compare payment behaviour over time?
A customer’s current payment time is more useful when you compare it with their previous behaviour. A customer moving from an average of 20 days to 35 days may deserve attention even if other customers routinely take longer to pay.
Does slower payment behaviour mean a customer is in financial difficulty?
Not necessarily. Slower payments can result from many factors, including changed payment terms, invoice disputes or administrative delays. Payment behaviour analysis can highlight unusual changes that deserve investigation, but it should not be used on its own to determine a customer’s financial position.
Can payment history help with cash-flow forecasting?
Yes. Historical payment behaviour can provide additional context when estimating when outstanding invoices are likely to be paid. Connectorly uses customer payment history as part of its approach to generating forecast data from Xero.
Turn Xero Payment History Into Actionable Insight
Knowing what your customers owe is important, but understanding how they normally pay can provide valuable additional context.
By combining historical invoice and payment data from Xero in Power BI, you can move beyond a snapshot of outstanding receivables and start identifying patterns in customer payment behaviour.
Average payment times, changes between reporting periods and comparisons with current outstanding balances can help finance teams identify unusual behaviour and decide where further investigation may be worthwhile.
The key is not to rely on a single metric. Payment behaviour becomes most useful when you combine historical patterns with current receivables, payment terms and the underlying invoice detail.
Connectorly makes Xero data available in a reporting-ready database for Power BI, including additional information designed to make financial reporting and analysis easier.
This allows you to spend less time preparing Xero data and more time using it to understand what is happening in your business.
Ready to Get More From Your Xero Data?
Connectorly brings your Xero data into a reporting-ready database for Power BI, helping you analyse receivables, customer payment behaviour, cash flow and other financial insights without manually preparing your data.
Explore Xero & Power BI