
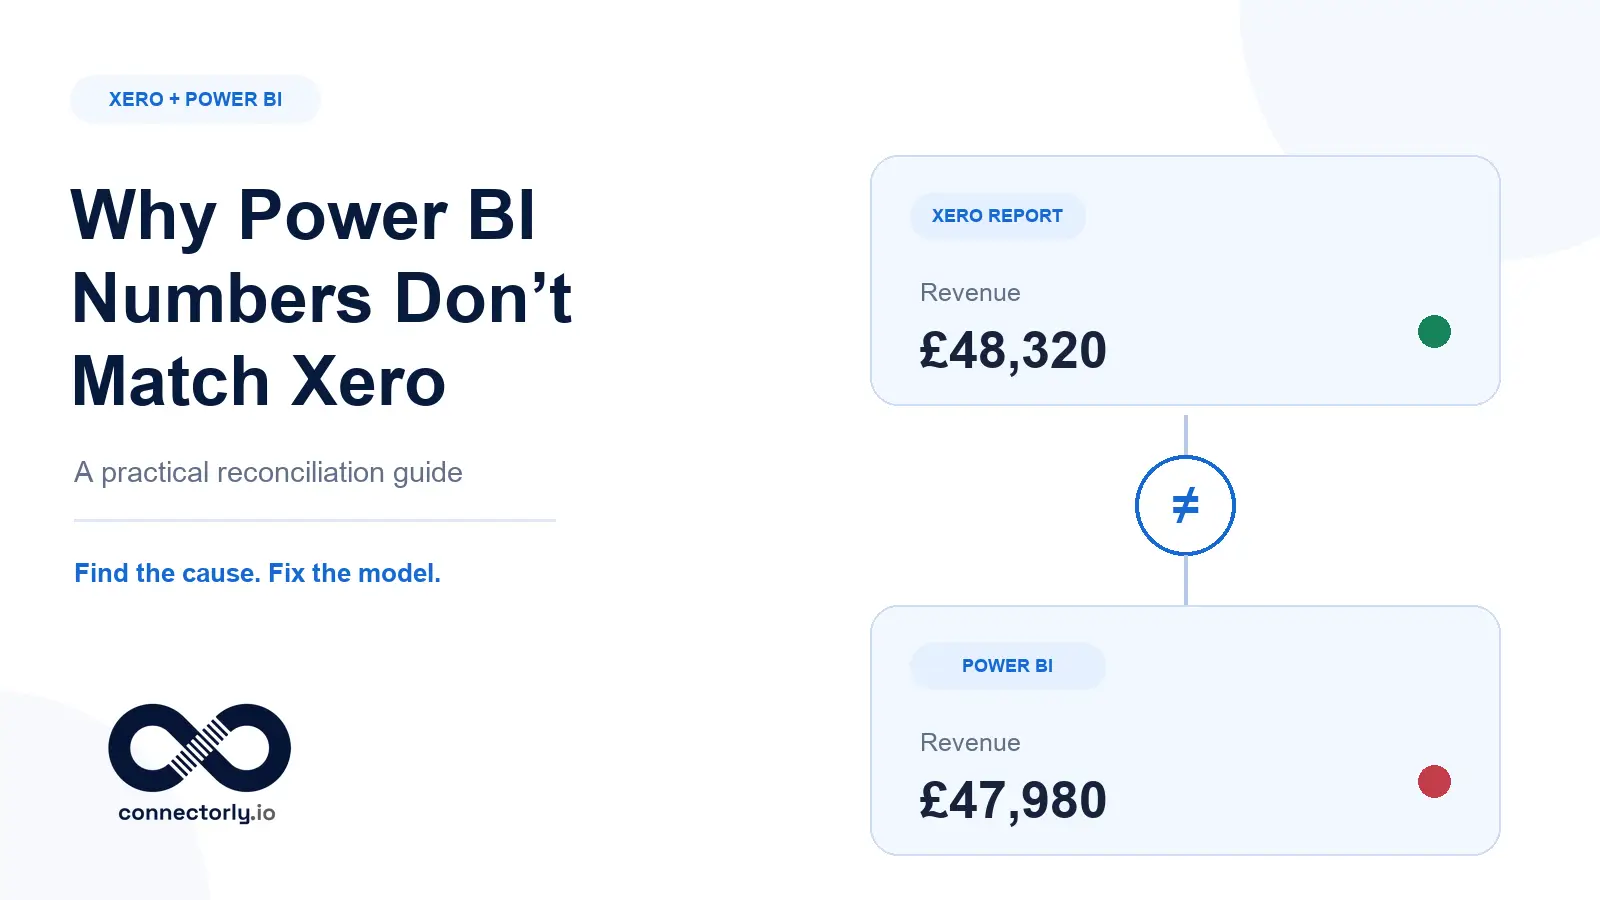
Why Power BI and Xero Figures Sometimes Differ
When a Power BI dashboard does not match a report in Xero, it is easy to assume that something has gone wrong with the integration. However, the data connection is only one possible cause.
In many cases, the two reports are simply using different settings or calculation rules. Xero might be showing figures on an accrual basis while Power BI uses payment dates. A report may include different transaction statuses, tracking categories, currencies or reporting periods. Power BI could also be displaying data from its previous refresh.
Differences can also originate inside the Power BI model. An incorrect relationship may duplicate transactions, while a filter or DAX measure may exclude records unexpectedly. Even when both systems contain the same underlying data, they can produce different totals if they group or calculate that data differently.
The solution is to reconcile the reports systematically. Start by confirming that both reports use the same organisation, period, accounting basis, currency and filters. You can then check the data refresh, transaction statuses, relationships and calculations.
This guide explains the most common causes and provides a practical process for finding and fixing the difference.
First, Confirm You Are Comparing Like with Like
Before investigating the integration or changing any Power BI calculations, confirm that both reports are answering the same question. Small differences in report settings can produce completely different results from identical underlying data.
Create the simplest possible comparison. Use one Xero organisation, one reporting period and one account. Choose either cash or accrual accounting, use the same currency and remove tracking-category filters. In Power BI, clear any visual-level, page-level and report-level filters that are not part of the comparison.
Check the following settings in both systems:
Xero organisation
Start and end dates
Cash or accrual accounting basis
Base or reporting currency
Tracking categories
Account codes
Transaction statuses
Tax-inclusive or tax-exclusive amounts
Last successful data refresh
Next, compare one account rather than an entire Profit and Loss statement or dashboard. A smaller test makes it much easier to identify the first transaction or calculation that creates the difference.
Record the expected Xero total and the Power BI total before making any changes. This gives you a controlled starting point and prevents filters or report settings from changing unnoticed during troubleshooting.
If you need more context about how Xero data, financial statements and Power BI models fit together, see our complete guide to Xero reporting in Power BI.
10 Common Reasons Power BI Numbers Don’t Match Xero
1. Power BI Has Not Refreshed Since Xero Changed
A refresh timing difference is the first thing to check because Xero and Power BI do not necessarily update at the same moment.
For example, an accountant may post a journal, approve an invoice or correct a transaction in Xero. The change appears immediately in Xero, but the Power BI report may still contain data from its previous refresh.
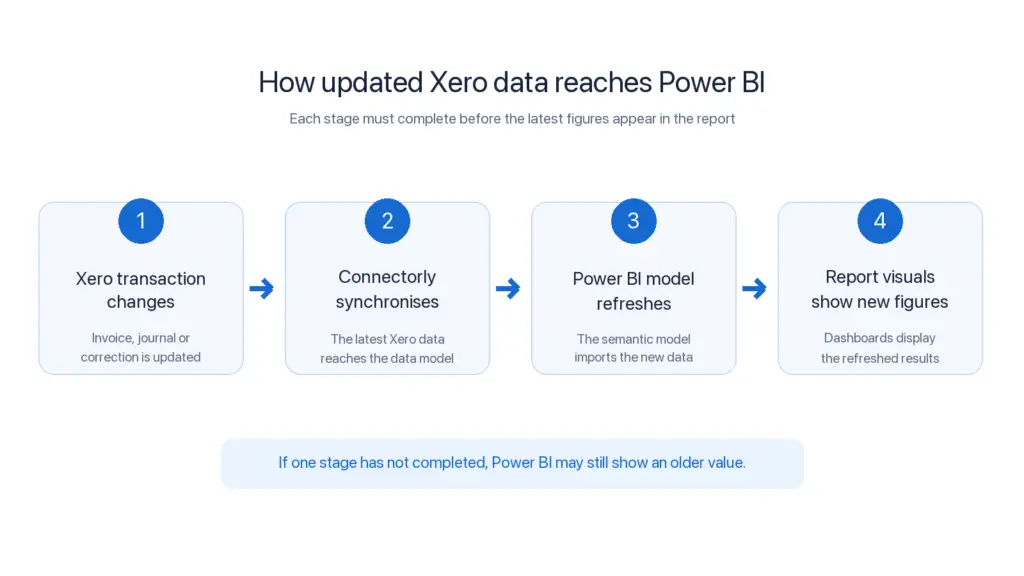
Remember that the update process can involve several stages:
A transaction changes in Xero.
The integration synchronises the latest Xero data.
The Power BI semantic model refreshes.
The report visuals display the refreshed model.
If one stage has not completed, Power BI can show an older value even though every calculation is correct.
Start by checking when the transaction changed in Xero. Next, review the latest successful synchronisation and the Power BI refresh history. Look for failed refreshes, warnings or a schedule that has not yet run.
Power BI Desktop and the Power BI service can also contain different versions of the data. Refreshing a file in Desktop does not automatically update a previously published semantic model. Likewise, refreshing the browser may redraw a report without importing new source data.
Once every stage has completed successfully, rerun the same controlled comparison before investigating the model itself.
2. Xero and Power BI Use Different Accounting Bases
Cash and accrual reports answer different financial questions, so comparing one basis with the other will produce a genuine difference.
Under accrual accounting, revenue and expenses appear when they are earned or incurred. Unpaid invoices and bills can therefore affect the result. Cash accounting records the financial impact when money is received or paid.
For example, imagine that Xero contains a £10,000 sales invoice dated 28 March that the customer pays on 15 April. An accrual report normally recognises the revenue in March, while a cash-based report recognises it in April.
Xero’s Profit and Loss report can be run on either a cash or accrual basis. Meanwhile, a Power BI calculation might use invoice dates, journal dates, payment dates or bank-transaction dates. The result depends on how the model and measure were designed.
First, check the accounting basis selected in the Xero report. Next, identify which Power BI table and date field support the value you are comparing. An invoice-based revenue measure should normally be compared with an accrual report, while a payment or bank-transaction measure may align more closely with cash reporting.
Neither result is necessarily wrong. They may simply represent different accounting events or reporting periods.
3. The Reports Use Different Date Fields or Calendars
A single Xero transaction can contain several dates, and each one may place the transaction in a different reporting period.
Consider an invoice dated 31 January, due on 28 February and paid on 10 March. Revenue analysed by invoice date appears in January. An aged-receivables calculation may use the February due date, while a cash-received measure records the payment in March.
Power BI measures must therefore use the date that matches the purpose of the report. A measure connected to Invoice Date will not necessarily agree with one based on Payment Date, Due Date, Journal Date or Bank Transaction Date.
The reporting calendar can create another difference. Xero may display results using the organisation’s financial year, while Power BI uses standard calendar months. Businesses using weekly periods or a 4-4-5 calendar may also have month and quarter boundaries that do not match conventional dates.
To investigate, select one transaction and identify every relevant date attached to it. Check which date appears in the Xero report, then review the date relationship and measure used in Power BI.
Finally, confirm that both reports use the same calendar structure and period boundaries. Our guide to accurate calendar reporting in Power BI explains how calendar, fiscal and ISO reporting periods affect financial results.
4. Transaction Statuses Are Being Treated Differently
Xero reports do not treat every invoice, bill or credit note in the same way. The transaction’s status determines whether and how it contributes to the financial statements.
For example, draft and awaiting-approval invoices are not equivalent to approved invoices. Voided or deleted transactions may remain visible in searches or underlying datasets for historical purposes even though Xero excludes them from standard report totals. Xero explains these differences in its guidance on deleting and voiding invoices.
Power BI models often retain several transaction statuses because operational dashboards may need to show drafts, outstanding invoices, paid items and historical records. However, a measure that simply sums every invoice amount could include records that the equivalent Xero report excludes.
Start by selecting an individual transaction that contributes to the difference. Check its current status in Xero and locate the same record in Power BI. Next, list the statuses included in the Power BI measure or visual.
Financial measures should apply status rules that match the Xero report being reconciled. Operational measures may intentionally use different rules, but the report should label them clearly.
Avoid removing historical records from the model solely to make one total agree. Instead, define the appropriate status filter within the measure so the same data can support several reporting purposes safely.
5. Invoices, Credit Notes and Payments Are Being Compared
Invoice value, recognised revenue, cash received and outstanding balance are related metrics, but they are not interchangeable.
Suppose a business raises an invoice for £1,200, applies a £200 credit note and receives a £600 payment. Ignoring tax for simplicity, the report could legitimately show:
Original invoice value: £1,200
Net sales after the credit note: £1,000
Cash received: £600
Remaining amount due: £400
Each figure is correct, but each answers a different question.
A Xero Profit and Loss report reflects the accounting effect of the invoice and credit note. An aged-receivables report focuses on the unpaid balance. Meanwhile, a Power BI invoice dashboard might display the original invoice value, and a cash-flow dashboard may use only payments or bank transactions.
Problems arise when reports use similar labels such as Revenue, Sales, Invoice Value or Cash In without defining the underlying calculation. Before comparing totals, identify whether each measure uses invoices, invoice lines, journals, payments or bank transactions.
Credit notes also require particular attention. Check whether the Power BI calculation subtracts them, excludes them or displays them separately. Then confirm how partial payments and refunds affect the measure.
Our guide to building a cash flow dashboard in Power BI using Xero data provides practical examples of payment- and bank-transaction-based reporting.
6. One Report Includes Tax and the Other Excludes It
Xero transactions can contain several monetary fields, including the subtotal before tax, tax amount and total including tax. Selecting the wrong field in Power BI can create a consistent percentage difference across an entire report.
For example, an invoice might contain:
Net amount: £1,000
Tax: £200
Gross amount: £1,200
A Profit and Loss report normally focuses on the amount allocated to revenue or expense accounts. However, an invoice or aged-receivables dashboard may display the full amount owed by the customer, including tax.
If Power BI sums the gross invoice total and you compare it with net revenue in Xero, the Power BI figure will be higher even though both values come from the same transactions.
Review the field used by the Power BI measure and determine whether it represents a net, tax or gross amount. Then compare it with a Xero report configured to show the equivalent value.
Small differences may also result from rounding. Xero and Power BI can round values at different stages, such as the transaction line, invoice total or final report. Minor differences of a few pence should therefore be investigated separately from larger structural discrepancies.
7. Filters, Tracking Categories or Organisations Don’t Match
Filters can change a report without making the change obvious to the person comparing the totals.
In Xero, a financial report may be filtered by tracking category, account or reporting period. Power BI can apply filters at several levels:
Visual-level filters
Page-level filters
Report-level filters
Slicers
Cross-filtering from another selected visual
User-specific saved filter states
A dashboard might therefore show one department even though the visible date slicer appears to include the whole organisation. In the Power BI service, previously selected filters may also persist between sessions.
Multi-organisation reports introduce another possibility. Xero displays one organisation at a time, while Power BI may include several grouped organisations. A consolidated total cannot agree with an individual Xero file unless the Power BI organisation filter selects that same entity.
Reset the Power BI report to its default state and clear any selected visuals. Next, inspect the complete Filters pane and confirm the organisation, account and tracking selections.
Apply the same filters in Xero before rerunning the comparison. If tracking categories are involved, our guide to creating and using custom tracking categories in Xero explains how they affect departmental, location and project reporting.
8. Currency Conversion Uses Different Rates or Dates
Multicurrency reporting can produce differences even when the original foreign-currency transaction agrees perfectly.
A transaction may contain values in several currencies:
The original transaction currency
The Xero organisation’s base currency
A separate reporting currency used in Power BI
The converted value depends on both the exchange rate and the date used for conversion. An invoice may use the rate available on its issue date, while its payment uses the rate on the settlement date. A report translated into another currency may apply yet another conversion method.
Realised and unrealised currency gains can also affect the comparison. An unpaid foreign-currency invoice may change in base-currency value as exchange rates move. Once payment occurs, the resulting gain or loss becomes realised. Foreign-currency bank accounts may also require revaluation adjustments.
Check that Xero and Power BI display the same currency before comparing totals. Next, identify whether the Power BI measure uses the transaction amount, base-currency amount or Connectorly reporting-currency amount. Review the exchange-rate date and any separate currency-adjustment entries.
Our guide to realised and unrealised currency gains and bank revaluation explains why these adjustments occur and how they influence Xero and Power BI reporting.
9. Power BI Relationships Duplicate or Exclude Transactions
A Power BI model can contain all the correct Xero records and still calculate an incorrect total if its relationships are not configured properly.
Xero reporting models commonly connect invoices, invoice lines, contacts, accounts, tracking categories and dates. These tables contain data at different levels of detail.
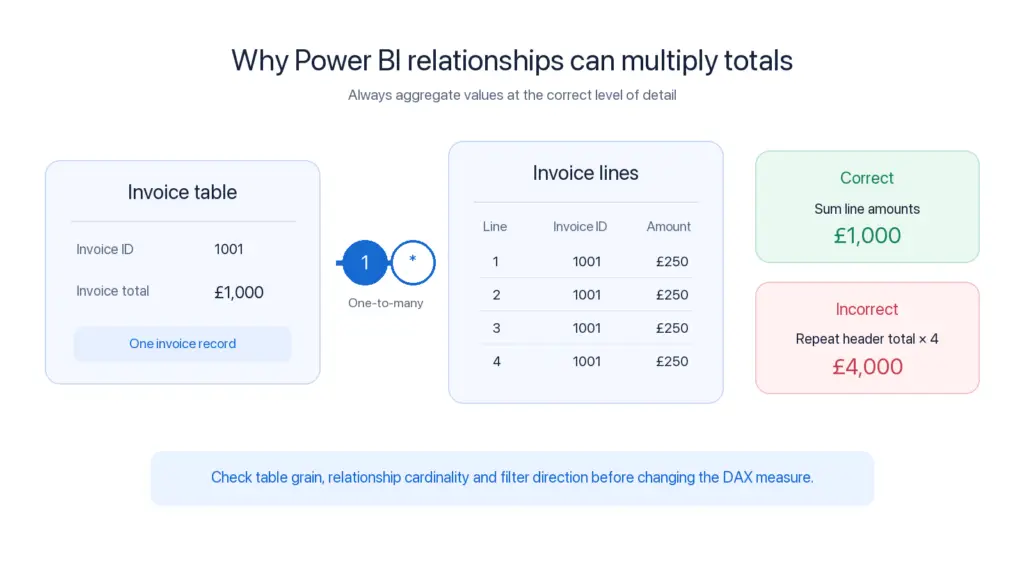
For example, imagine an invoice with a total value of £1,000 and four invoice lines. If the invoice total is repeated against every line and then summed, Power BI could return £4,000 instead of £1,000.
Many-to-many relationships, duplicate identifiers and inappropriate bidirectional filtering can create similar problems. Conversely, a missing or inactive relationship may prevent valid transactions from appearing when a user selects an account, date or tracking category.
Microsoft’s Power BI relationship troubleshooting guidance recommends checking whether relationships exist, whether they are active, their cardinality, filter direction, linked columns and data types.
Start by displaying the transaction identifier and amount in a simple table visual. Count how many times each transaction appears. Then inspect Model view and confirm that each relationship joins the intended keys at the correct level of detail.
Avoid changing a DAX measure until you know whether the underlying model is duplicating or excluding rows.
10. The DAX Measure Uses Different Calculation Logic
Even with accurate data and correct relationships, a DAX measure can produce a result that differs from Xero because it applies different business rules.
A measure may intentionally:
Include only selected account classes
Exclude forecast or voided transactions
Use absolute values for expenses
Apply a reporting-currency conversion
Ignore or override particular filters
Calculate a running balance
Compare a different date period
Power BI totals can also behave unexpectedly. A total row does not always add the visible rows above it. Instead, Power BI recalculates the measure using the broader filter context of the total. This is correct DAX behaviour, but it can surprise users expecting simple addition.
Begin troubleshooting with a table that shows transaction identifiers and raw amounts. Create or use a simple sum measure and compare it with the more complex financial measure. If the simple total agrees with Xero, the difference probably comes from the additional DAX logic.
Review each filter and calculation in the measure individually. Confirm its treatment of account classes, signs, dates, statuses, currencies and blank values. The objective is not merely to force the final number to match, but to ensure the measure follows the intended accounting definition.
Our guide to prebuilt Power BI measures for Xero reporting explains the purpose and calculation logic behind many common financial and operational KPIs.
A Step-by-Step Xero-to-Power-BI Reconciliation Checklist
The fastest way to find a discrepancy is to work from Xero towards the final Power BI visual. Avoid changing several parts of the model at once.
Record the difference
Write down the Xero value, Power BI value and exact difference before changing anything.Confirm the organisation
Make sure Power BI is filtered to the same Xero organisation—or the intended group of organisations.Align the report settings
Use identical dates, accounting basis, currency, accounts and tracking categories.Test one account
Choose the account with the clearest difference instead of reconciling an entire financial statement.Locate individual transactions
Compare transaction identifiers, dates, statuses and amounts in both systems.Confirm the latest refresh
Check the Connectorly synchronisation and Power BI refresh history for failures, warnings or delays.Compare equivalent values
Confirm whether both reports use net, tax, gross, invoice, payment, journal or bank-transaction amounts.Check currencies and exchange rates
Use the same currency and identify any realised, unrealised or revaluation adjustments.Inspect the Power BI model
Review relationship keys, cardinality, filter direction and duplicate records.Validate the DAX measure
Confirm that its filters, signs, date logic and totals match the intended accounting definition.
Correct source-data problems in Xero wherever possible. Our guide to using Xero Find & Recode explains how to correct account codes, tracking categories and other transaction details efficiently.
After each change, rerun the original controlled comparison. This makes it clear which adjustment resolved the discrepancy.
When a Difference Is Expected
Not every difference between Xero and Power BI indicates an error. Some reports are designed to calculate different values.
A difference may be expected when:
One report uses cash accounting and the other uses accrual accounting
Power BI displays a reporting currency rather than Xero’s base currency
The reports use different transaction dates
One measure includes forecasts or draft transactions
A dashboard shows original invoice value rather than outstanding balance
Power BI combines several Xero organisations
Exchange-rate movements create realised or unrealised gains
The reports apply different rounding rules
Power BI has not yet completed its scheduled refresh
Operational dashboards can also use definitions that do not exist in Xero’s statutory financial reports. For example, management may define adjusted revenue that excludes intercompany sales, exceptional transactions or particular business units. That figure should not be expected to match unadjusted Xero revenue.
The important requirement is transparency. Every financial measure should have a clear definition that explains its data source, date field, accounting basis, currency, filters and exclusions.
If the difference is intentional, document it within the report or supporting guidance. If nobody can explain why the values differ, continue the reconciliation process until the cause is understood.
How to Prevent Xero and Power BI Discrepancies
Reconciliation becomes much easier when the reporting process is designed around consistent definitions and repeatable controls.
Start with a written definition for every important KPI. Record the source table, amount field, date field, accounting basis, currency, status filters and any exclusions. This prevents terms such as Revenue or Cash Flow from acquiring different meanings across reports.
Use a structured Power BI model with dedicated date, account, organisation and tracking dimensions. Avoid connecting tables simply because their columns have similar names. Relationships should use stable identifiers and reflect the correct level of detail.
Other useful controls include:
Automated and monitored data refreshes
A visible “data current as of” timestamp
Standard measures reused across report pages
A dedicated reconciliation page
Transaction-level drill-through
Clear organisation and currency selectors
Testing after model or measure changes
A documented month-end validation process
Keep complex business adjustments separate from the raw accounting values. For example, show Xero Revenue and Adjusted Management Revenue as distinct measures instead of silently changing the definition of revenue.
The data connection also needs to remain stable as reporting requirements grow. Our comparison of a direct Xero API connection and a reporting connector explains how authentication, pagination, modelling and refresh maintenance affect reporting reliability.
Finally, assign ownership. Someone should be responsible for investigating refresh failures, approving calculation changes and confirming that key reports reconcile after each accounting period.
How Connectorly Supports Reliable Xero Reconciliation
Connectorly reduces several technical causes of reporting discrepancies by preparing Xero data in a structured format before Power BI uses it.
Instead of requiring Power BI to retrieve and reshape raw API responses during every refresh, Connectorly for Xero and Power BI manages the Xero data extraction and makes the resulting datasets available for reporting.
The Connectorly Xero Data Model organises related information such as invoices, contacts, accounts, journals, payments, tracking categories and dates. This gives report developers a consistent foundation for relationships, measures and financial dashboards.
Connectorly also supports:
Automated Xero data synchronisation
Reporting across multiple Xero organisations
A common reporting currency
Structured fiscal and calendar date tables
Custom account, contact and product groupings
Prebuilt Power BI templates and measures
These features reduce the amount of extraction and transformation logic that teams need to maintain inside Power BI. They also make it easier to investigate a difference at the transaction level.
Connectorly also applies automated validation beyond data preparation. Learn how Connectorly validates Xero data in Power BI through account-by-account reconciliation, customer-accessible audit views and pre-release regression testing.
However, a structured data connection does not remove the need for reconciliation. Incorrect source transactions, mismatched report settings, inappropriate relationships or unsuitable DAX calculations can still create differences.
The most reliable approach combines clean Xero data, a structured reporting model, clearly defined measures and a repeatable reconciliation process.
Final Thoughts
When Power BI numbers do not match Xero, avoid assuming that either system is immediately wrong.
Most discrepancies come from differences in refresh timing, accounting basis, dates, transaction statuses, currencies, filters, relationships or measure definitions. Once you compare the same organisation, period, accounting basis and metric, the possible causes become much easier to isolate.
Begin with one account and a small number of transactions. Work from the source data in Xero through the synchronisation process, Power BI model and final DAX calculation. This approach is faster and safer than repeatedly changing formulas until the total happens to agree.
Some differences are intentional. Management reports may use adjusted definitions, consolidated organisations or reporting currencies that do not exist in the original Xero report. These values remain useful as long as their calculation and purpose are clearly documented.
Ultimately, trustworthy reporting is not achieved by making two numbers look the same. It comes from understanding precisely how each number was produced and being able to explain any difference.
Frequently Asked Questions
Why doesn’t my Power BI Profit and Loss report match Xero?
The most common causes are different accounting bases, date periods, currencies, filters or transaction statuses. First confirm that both reports use the same Xero organisation, period and cash or accrual basis. Then check the latest refresh, account mappings, Power BI relationships and DAX measure logic.
Should Xero or Power BI be treated as the source of truth?
Xero should normally remain the source of truth for the underlying accounting transactions. Power BI provides a reporting and analytical layer over that data. However, management measures in Power BI may intentionally use adjusted definitions. Any difference should be documented and explainable.
Can Power BI match Xero exactly?
Yes, when both reports use the same data, accounting basis, dates, currencies, filters and calculation rules. Exact agreement may not be appropriate when Power BI displays consolidated organisations, adjusted management metrics, forecasts or reporting-currency values that do not exist in the original Xero report.
Why does Power BI show old Xero figures?
The Xero data may have synchronised, but the Power BI semantic model might not have refreshed yet. Check the integration’s latest successful synchronisation, the semantic-model refresh history and the timestamp displayed in the report. Remember that refreshing browser visuals does not necessarily import new source data.
Why does an invoice total differ from revenue or cash received?
The original invoice value, net revenue, outstanding balance and cash received represent different stages of the transaction. Credit notes, partial payments, tax and payment dates can change each value. Compare the Power BI measure with the equivalent Xero report rather than assuming every sales-related total should agree.
How do I reconcile multiple Xero organisations in Power BI?
Filter Power BI to one organisation and reconcile it with the corresponding Xero file first. Repeat the process for each entity before validating the consolidated total. Account mappings, tracking categories and currencies must also be aligned. See our guide to consolidating multiple Xero organisations in Power BI for a detailed explanation.