
Price update from June 1, 2026
Lock in your current price for another year by switching to annual billing.
👉 Learn more: https://connectorly.io/june-2026-pricing-changes/

The Complete Guide to HubSpot Reporting in Power BI

The Complete Guide to HubSpot Reporting in Power BI by Connectorly

What Is HubSpot Reporting in Power BI?

HubSpot reporting in Power BI means bringing data from HubSpot into Microsoft Power BI so that you can create customised sales, marketing, service and executive reports.

HubSpot already includes useful dashboards and reporting tools. For many organisations, these native reports provide everything needed to monitor individual sales pipelines, marketing campaigns and customer service activity. However, reporting requirements often become more complex as a business grows.

Power BI becomes particularly valuable when you need to:

  • Analyse information across several HubSpot objects

  • Create calculations that are difficult to reproduce in HubSpot

  • Compare performance across multiple pipelines or HubSpot accounts

  • Preserve and analyse historical changes

  • Combine HubSpot with financial or operational systems

  • Build consistent executive dashboards for the whole organisation

As a result, HubSpot and Power BI should not necessarily be viewed as competing reporting platforms. Many organisations use HubSpot dashboards for everyday CRM management while using Power BI for deeper analysis, consolidated reporting and management decision-making.

If you are still deciding which platform should handle a particular reporting requirement, our comparison of HubSpot native reporting and Power BI explains where each approach works best.

What HubSpot data can you analyse in Power BI?

Depending on your HubSpot subscription, configuration and connection method, Power BI can be used to analyse data relating to:

  • Deals and sales pipelines

  • Contacts and companies

  • Deal stages and conversion rates

  • Sales activities, calls, meetings, emails and tasks

  • Marketing sources and campaign performance

  • Quotes and associated deal values

  • Customer service tickets

  • Owners, teams and individual performance

  • Standard and custom HubSpot properties

These datasets can support anything from a straightforward pipeline dashboard to a complete executive reporting model combining sales, marketing, service and finance.

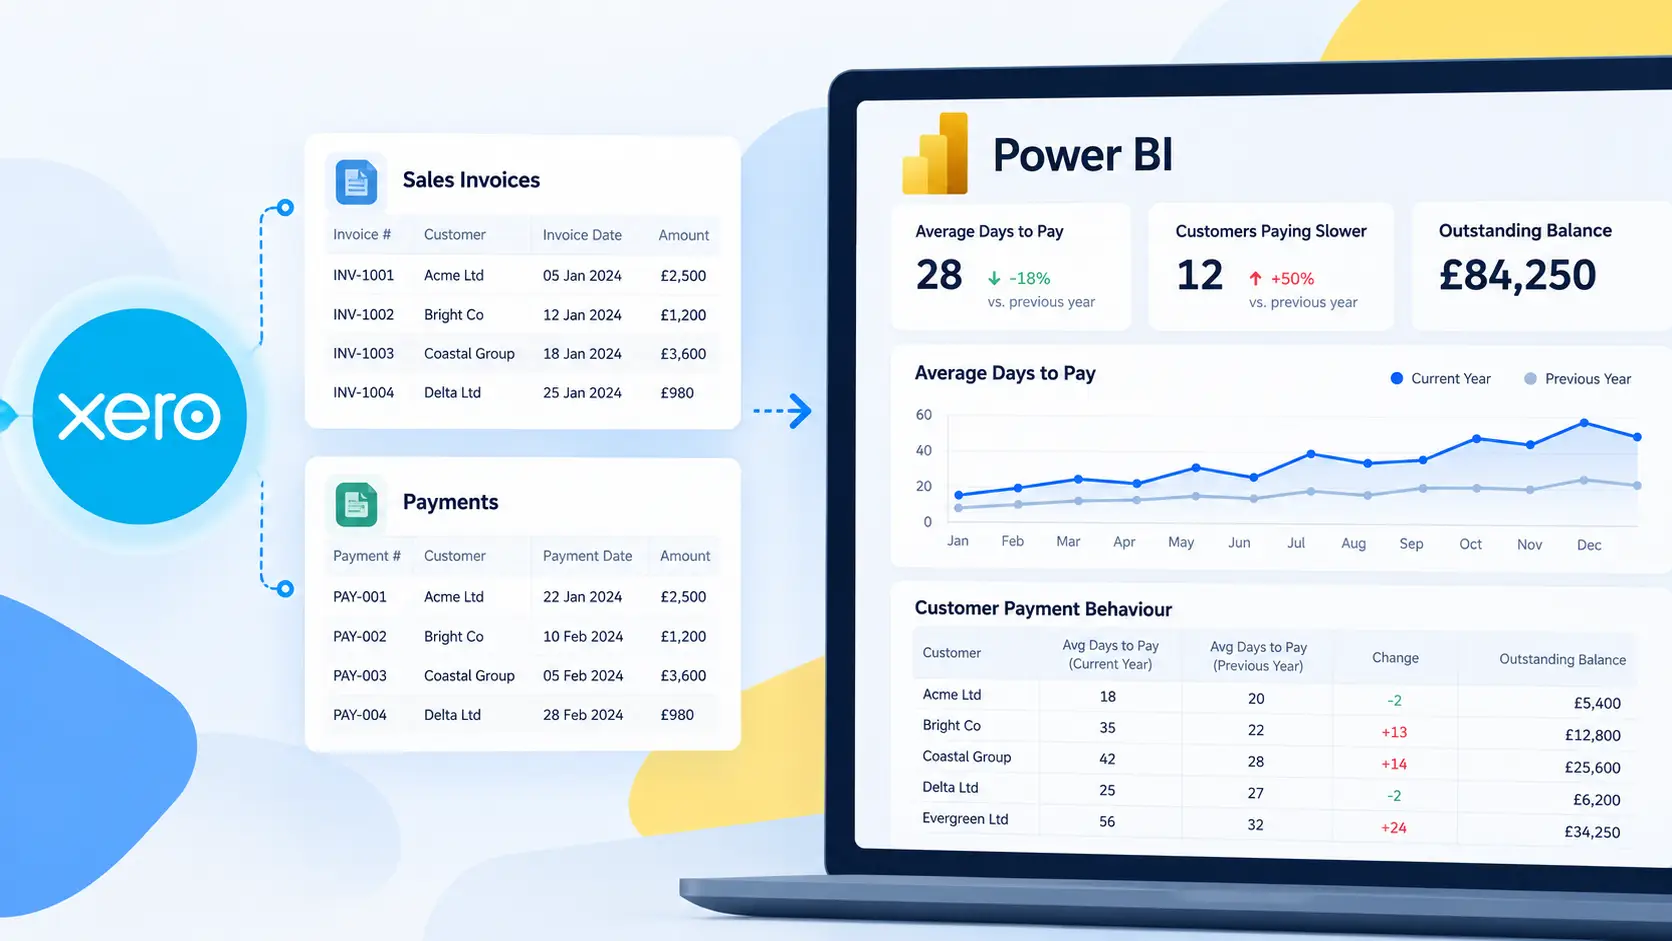
For example, a sales manager might use Power BI to compare pipeline value, win rates and average sales-cycle length by owner. Meanwhile, a finance director might combine HubSpot deals with Xero invoices to compare expected revenue with amounts that have actually been invoiced or received.

What will this guide cover?

This guide explains the complete HubSpot and Power BI reporting process. We will look at when HubSpot’s native reports are sufficient, when Power BI becomes useful, the different ways to connect the platforms and how HubSpot data should be structured for reporting.

We will also explore practical dashboards and KPIs for sales, marketing, customer service and senior management. Later chapters will explain custom properties, historical reporting, data validation, cross-system reporting and the role Connectorly can play in preparing HubSpot data for Power BI.

By the end of the guide, you should understand both the technical process and the reporting decisions required to create reliable HubSpot dashboards in Power BI.

When Are HubSpot’s Native Reports Enough?

Before moving HubSpot data into Power BI, it is worth asking whether HubSpot’s own reporting tools already meet your requirements.

HubSpot provides dashboards, standard reports, single-object reports, funnel reports, attribution reports and a custom report builder. Depending on your subscription, the HubSpot custom report builder can analyse several related CRM data sources and combine object, property, activity and event information.

For many sales, marketing and customer service teams, these capabilities are more than sufficient.

HubSpot reporting is usually enough when:

  • All the information you need already exists in HubSpot

  • You are monitoring a single sales pipeline or business unit

  • Your reports use standard HubSpot objects and properties

  • Users need operational dashboards inside the CRM

  • You want reports that sales and service teams can access without leaving HubSpot

  • Your calculations can be created using HubSpot’s available reporting tools

  • You do not need to combine HubSpot with accounting or operational systems

For example, a sales manager who wants to monitor open pipeline value, deals by stage, activities by owner and monthly closed-won revenue may be able to build everything directly in HubSpot.

Similarly, a customer service manager can use HubSpot dashboards to monitor ticket volume, response times, resolution performance and team workloads. Keeping these reports inside HubSpot gives operational users immediate access to the information alongside the records they work with every day.

When does Power BI become useful?

Power BI becomes valuable when the reporting question extends beyond HubSpot’s operational environment.

Common examples include:

  • Combining HubSpot with Xero, Microsoft 365 or another business system

  • Creating one executive dashboard across several departments

  • Reporting across multiple HubSpot organisations

  • Building specialised calculations or reusable KPI measures

  • Applying a consistent data model across sales, marketing and finance

  • Creating highly customised report layouts and interactions

  • Analysing information at a more detailed level

  • Managing reporting independently from individual HubSpot dashboards

Suppose HubSpot shows ÂŁ500,000 of closed-won deals. Management may then want to know how much of that value has been invoiced, how much has been paid and how much remains outstanding. HubSpot cannot answer the entire question alone because the financial transactions live in an accounting platform such as Xero.

Power BI can bring these datasets together and present CRM activity alongside financial outcomes.

You may not need to choose only one platform

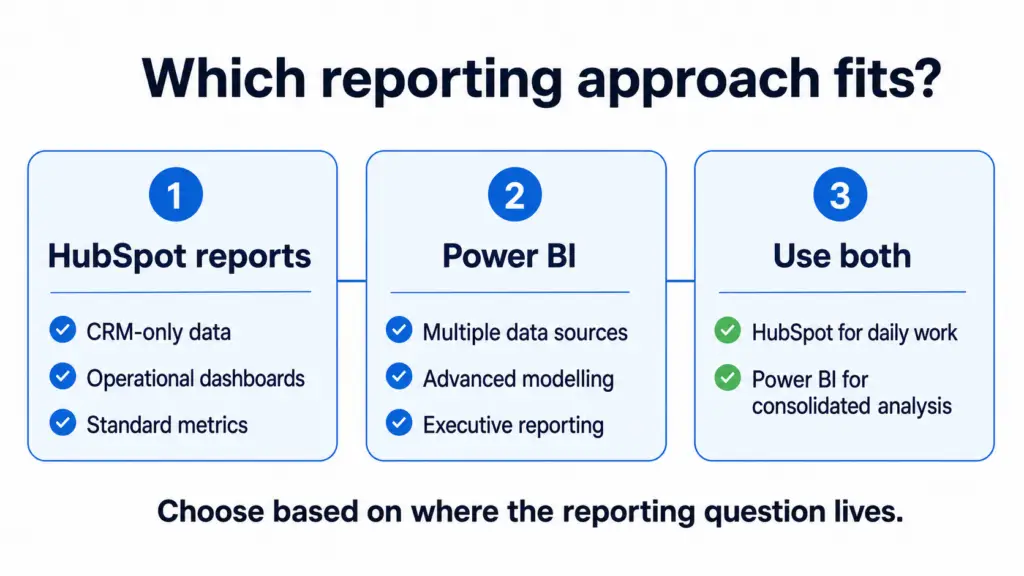
In practice, HubSpot and Power BI often serve different audiences.

Sales representatives and service teams can continue using HubSpot for daily operational visibility. Meanwhile, managers, analysts and executives can use Power BI for consolidated reporting, advanced analysis and comparisons across systems.

This approach avoids replacing useful HubSpot dashboards unnecessarily. Instead, Power BI adds a broader analytical layer when the organisation needs it.

Our article covering five reasons HubSpot and Power BI work better together explores the most common situations that lead organisations to introduce Power BI alongside HubSpot.

The important question is therefore not whether Power BI is universally better than HubSpot reporting. The better question is whether your reporting requirements remain inside HubSpot or extend across the wider organisation.

Comparison of HubSpot reports, Power BI and using both platforms for business reporting.

What Can You Report on with HubSpot Data in Power BI?

HubSpot contains information from across the customer lifecycle. Once that data is available in Power BI, it can support four broad types of reporting: sales, marketing, customer service and executive reporting.

The exact information available depends on your HubSpot subscription, the features your organisation uses and the method used to bring the data into Power BI.

Sales and pipeline reporting

Sales reporting is one of the most common reasons organisations connect HubSpot to Power BI.

A sales dashboard might include:

  • Open pipeline value

  • Weighted pipeline value

  • Deals created and closed

  • Win and loss rates

  • Average deal value

  • Average sales-cycle length

  • Deal conversion by stage

  • Performance by owner or team

  • Pipeline coverage against targets

  • Expected revenue by close date

Power BI also makes it possible to compare several pipelines using a consistent set of calculations. This is particularly useful when different teams, regions or business units use their own HubSpot pipelines.

However, deal amount and close date should always be interpreted carefully. A deal’s value represents what the sales team expects or records in HubSpot. It does not automatically represent invoiced, recognised or received revenue.

Marketing reporting

HubSpot provides extensive tools for monitoring marketing activity. Power BI can extend this information by combining marketing performance with sales and financial outcomes.

Possible marketing reports include:

  • Leads and contacts created by source

  • Marketing-qualified and sales-qualified leads

  • Landing-page and form performance

  • Campaign-generated contacts and deals

  • Conversion through lifecycle stages

  • Cost per lead or acquisition

  • Revenue associated with marketing sources

  • Performance by channel, campaign or region

Attribution requires particularly careful definition. Different attribution models can assign credit to different interactions, so a dashboard should clearly state which model and date logic it uses.

In addition, marketing cost data may live outside HubSpot. Power BI can combine HubSpot outcomes with advertising, finance or budgeting data to create a more complete performance view.

Customer service and engagement reporting

HubSpot data can also support reports covering customer service and ongoing engagement.

Examples include:

  • Tickets opened and resolved

  • Ticket backlog

  • Average response and resolution times

  • Tickets by category, priority or owner

  • Calls, meetings, emails and tasks

  • Customer activity over time

  • Companies or contacts with declining engagement

  • Workload and performance by service team

These reports can help teams identify bottlenecks and customers who may require attention. However, activity volume should not be treated as a performance measure on its own. A high number of calls or emails does not necessarily mean that the activity was effective.

Executive and cross-system reporting

Executive reporting normally combines information from several departments and systems.

A leadership dashboard might present:

  • Pipeline and forecast value

  • Closed-won sales

  • Invoiced and recognised revenue

  • Cash collected

  • Customer acquisition cost

  • Customer lifetime value

  • Sales and marketing conversion

  • Customer retention indicators

  • Performance against targets

This is where Power BI becomes especially useful. HubSpot can provide the CRM and customer-journey information, while systems such as Xero provide the financial results.

For example, HubSpot may show when a deal was won and its expected value. Xero can show whether the customer was invoiced, whether payment was received and whether any balance remains outstanding. Combining the two creates a clearer view of commercial performance.

The Connectorly HubSpot data model provides structured tables for deals, companies, contacts, calls, emails, meetings, quotes, tasks, tickets and other HubSpot information. Later in this guide, we will examine how these tables fit together inside Power BI.

How Can You Connect HubSpot to Power BI?

Connecting HubSpot to Power BI involves moving CRM data into a format that Power BI can query, model and refresh.

There are several ways to achieve this. The right choice depends on whether you need a one-off analysis, an internally developed integration or a managed reporting solution.

Option 1: Export HubSpot data manually

The simplest approach is to export records or report data from HubSpot and import the resulting CSV or Excel files into Power BI.

This can work well when:

  • You are creating a one-off analysis

  • The dataset is small

  • Reports do not need frequent updates

  • You are testing an idea before investing in automation

However, manual exports become difficult to maintain as reporting grows. Someone must repeat the export, replace the files and refresh the Power BI model whenever new information is required.

Different HubSpot objects may also arrive in separate files. Consequently, the report developer must create and maintain relationships between contacts, companies, deals, owners and activities.

Manual exports are therefore useful for prototypes, but they are rarely the best foundation for recurring management reporting.

Option 2: Build a direct HubSpot API integration

HubSpot provides APIs that developers can use to retrieve CRM objects, properties and associations.

A custom integration offers extensive control over:

  • Which HubSpot objects are retrieved

  • Which standard and custom properties are included

  • How frequently data is refreshed

  • How associations are processed

  • Where the extracted data is stored

  • How historical information is preserved

However, this approach requires development and ongoing maintenance. The solution must manage authentication, pagination, API versions, errors, changing schemas and the relationships between HubSpot objects.

It must also operate within HubSpot’s API usage guidelines and limits. These requirements can vary according to the API, application type and HubSpot subscription.

Calling an API is only one part of the work. The extracted records still need to be cleaned, structured and modelled before they become useful for reporting.

A custom API integration is therefore most suitable when an organisation has specialist development resources or reporting requirements that cannot be met through an existing solution.

Option 3: Use a third-party connector or data platform

A managed connector extracts data from HubSpot and makes it available to Power BI, often through a database, data warehouse or supported Power BI data source.

This removes much of the API engineering work. Nevertheless, connector capabilities vary considerably.

Before selecting a solution, check:

  • Which HubSpot objects and activities are supported

  • How object associations are represented

  • Whether standard and custom properties are included

  • How frequently the data refreshes

  • Whether multiple HubSpot organisations can be combined

  • How historical changes are handled

  • Whether the resulting structure is easy to model

  • How credentials and customer data are secured

  • Whether templates or a prebuilt model are available

A connector should do more than move individual tables. It should also make the data understandable and reliable enough to support recurring reports.

Option 4: Use Connectorly for HubSpot and Power BI
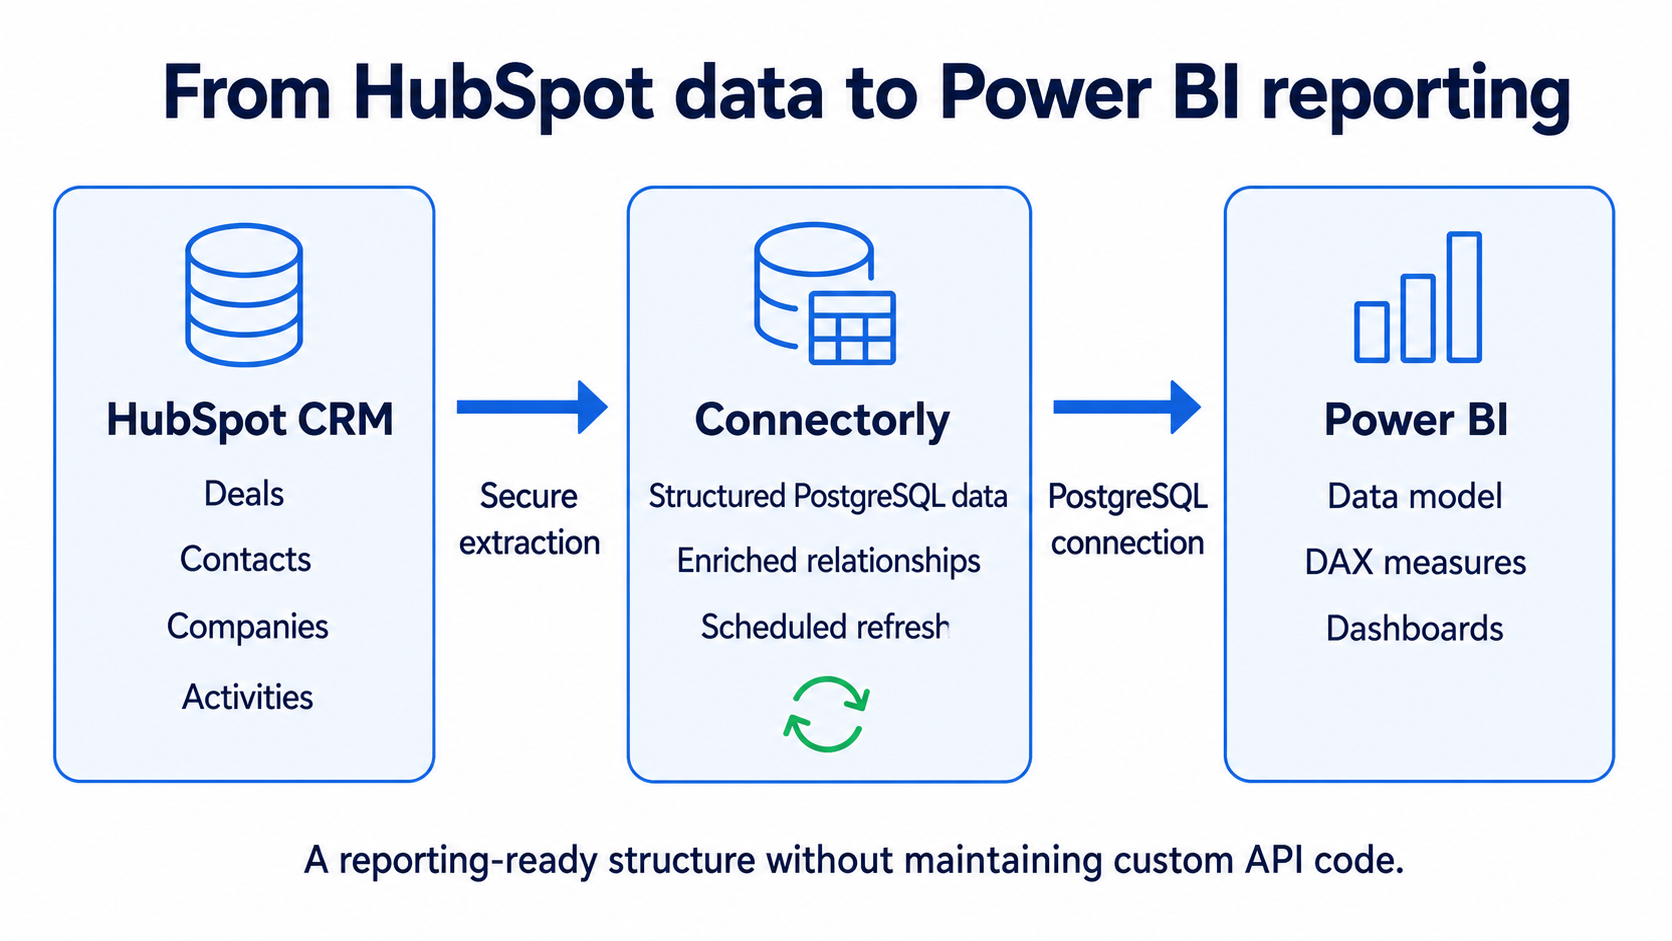
HubSpot CRM data securely extracted into Connectorly’s structured PostgreSQL database and connected to Power BI.
How Connectorly prepares HubSpot data for reporting in Power BI.

Connectorly extracts HubSpot data and stores it in a structured PostgreSQL database prepared for Power BI reporting.

Instead of building and maintaining API queries, users connect Power BI to their Connectorly database using the PostgreSQL data source. The available tables include CRM objects and activities such as companies, contacts, deals, owners, calls, meetings, emails, tasks, quotes and tickets.

Connectorly also provides an enriched data model and a customisable HubSpot Power BI template. This gives report builders a starting point while retaining the flexibility to create their own relationships, calculations and visuals.

The basic process is:

  1. Create the HubSpot and Power BI connector in Connectorly.

  2. Authorise the required HubSpot organisation.

  3. Allow Connectorly to prepare the HubSpot data.

  4. Open the Connectorly template or a new Power BI file.

  5. Connect using the PostgreSQL details supplied by Connectorly.

  6. Select the required tables and load the data.

Our guide explaining how to connect HubSpot to Power BI provides a more detailed walkthrough of this process.

Which connection method should you choose?

Manual exports are suitable for temporary or experimental reports. A custom API integration provides maximum technical control, but it also creates the greatest maintenance responsibility.

A managed connector is generally more appropriate when reports must refresh reliably without an internal development project.

Whichever method you choose, evaluate the resulting data structure rather than focusing only on the initial connection. A fast connection is not particularly useful if contacts, companies, deals and activities remain difficult to relate or interpret inside Power BI.

Understanding the HubSpot Data Model in Power BI

HubSpot is built around connected CRM objects rather than one flat reporting table. Deals can be associated with contacts and companies, while activities such as calls, meetings, emails and tasks can relate to several different records.

A reliable Power BI model should preserve this structure. Flattening everything into one large table may appear convenient, but it can duplicate values and produce incorrect totals.

The main HubSpot reporting tables

The Connectorly HubSpot data model separates information into tables representing the main CRM objects and activities.

Important tables include:

  • Deals: sales opportunities, values, pipelines, stages, owners and important deal dates

  • Contacts: individual people recorded in HubSpot

  • Companies: organisations associated with contacts, deals and activities

  • Owners: HubSpot users responsible for records and activities

  • Calls: inbound and outbound calls

  • Meetings: scheduled or completed meetings and their outcomes

  • Emails: recorded email activities

  • Tasks: activities assigned to owners, including their status and due dates

  • Quotes: commercial quotes associated with deals, contacts and companies

  • Tickets: customer service records

  • Dates: a shared calendar table for analysing activity over days, weeks, months, quarters and years

  • Company and contact timelines: consolidated views of activities associated with companies or contacts

Keeping these areas separate allows Power BI to aggregate each type of information at the correct level.
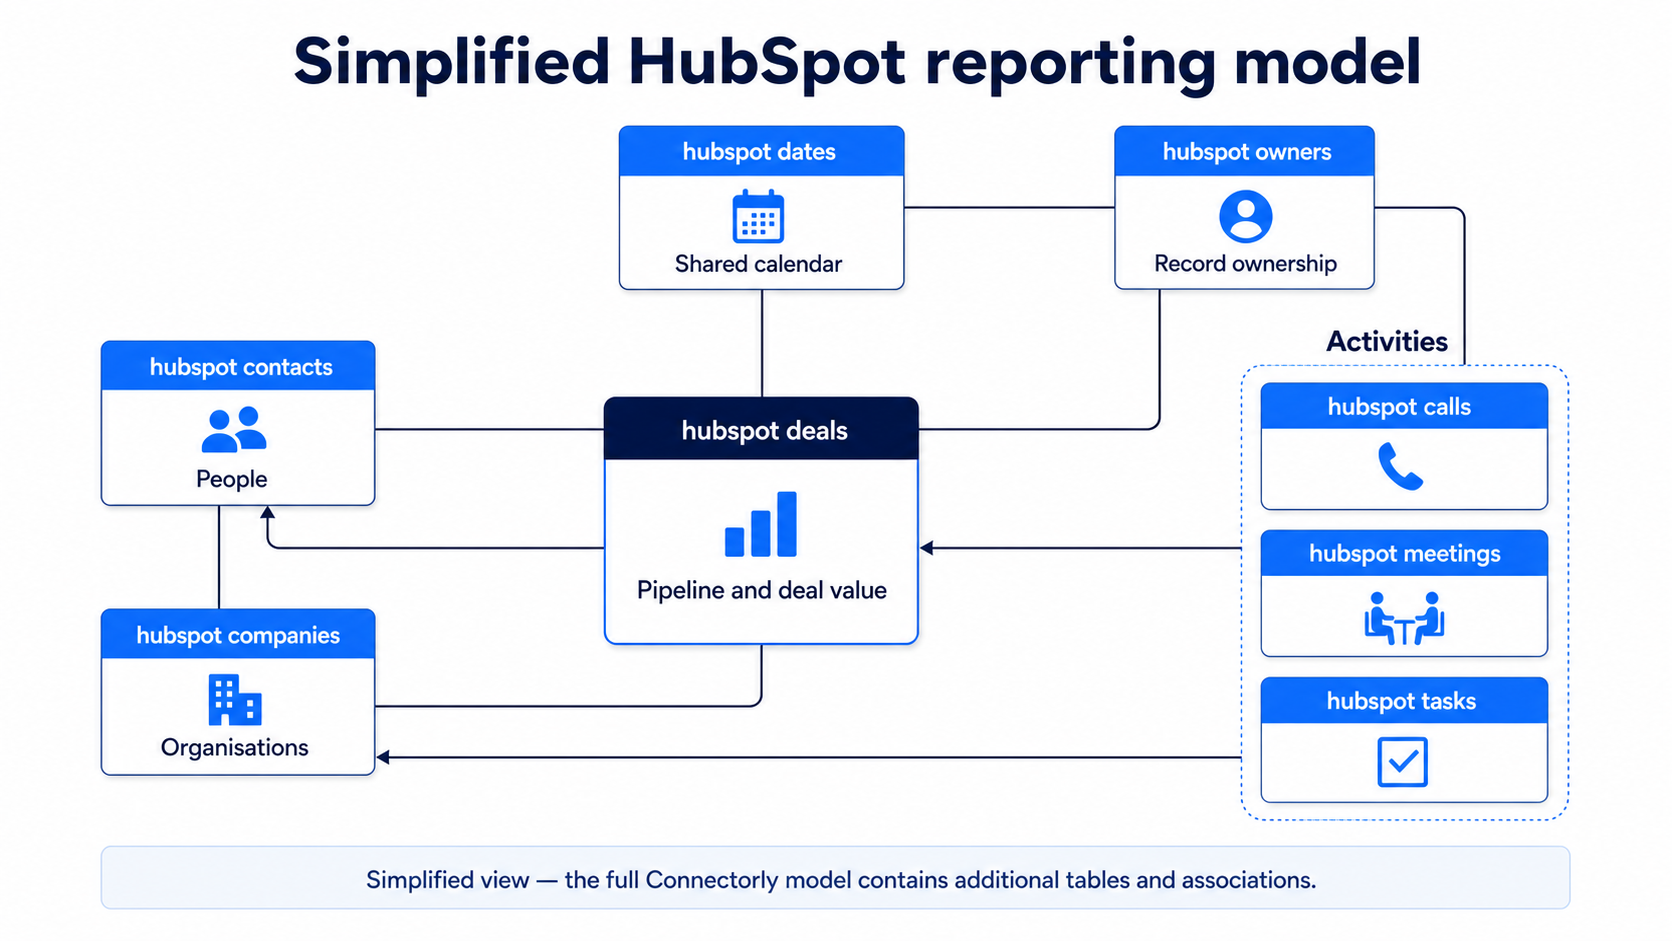
Simplified HubSpot Power BI data model showing deals, contacts, companies, dates, owners and activity tables.
A simplified view of the core HubSpot tables and relationships used in the Connectorly Power BI model.

Understand the level of detail in each table

Before creating a calculation, identify what one row represents.

In the Deals table, one row normally represents one HubSpot deal. Therefore, summing deal amount can produce a valid pipeline total when the appropriate filters are applied.

In an activity table, however, one row represents an individual call, meeting, email or task. Joining these rows directly to deals can repeat the deal value when one deal has several associated activities.

For example, a £10,000 deal associated with five calls should still contribute £10,000 to pipeline value—not £50,000.

This is why measures should normally be calculated from the table that owns the value. Deal amount should come from Deals, while call counts should come from Calls.

How HubSpot associations work

HubSpot records can have several associations. A deal may relate to multiple contacts, a company may have several deals and an activity may be associated with a company, contact and deal at the same time.

Connectorly makes common relationships easier to use by providing fields such as:

  • Primary Company ID

  • Primary Contact ID

  • Primary Deal ID

  • Owner ID

  • Connection Name

Some tables also contain arrays of associated records. These preserve associations beyond the primary record and can support more advanced reporting scenarios.

For a straightforward sales dashboard, the primary IDs may provide everything required. More complex reporting—such as allocating one deal across several associated companies—may require a bridge table or additional Power Query preparation.

The important point is to decide how each association should affect the report. Power BI should not guess how a many-to-many relationship ought to allocate value.

Dates require deliberate modelling

HubSpot records often contain several useful dates. A deal may have a creation date, expected close date, actual close date and last-updated date.

Each date answers a different question:

  • Creation date shows when pipeline entered the system

  • Close date supports sales and forecasting analysis

  • Actual closed-won timing supports historical performance

  • Updated date helps identify recent changes

  • Activity dates show when calls, meetings or tasks occurred

A single chart should use the date that matches its business question. For example, deals created by month should not accidentally use the expected close date.

Connectorly includes dedicated date fields that can be related to its Dates table. More advanced models may use inactive relationships or separate role-playing date tables when several date perspectives must appear in the same report.

Owners and multiple HubSpot organisations

Owner ID connects HubSpot records to the Owners table. This allows reports to display a person’s name and analyse deals, activities or tickets by owner.

Use the owner responsible for the record rather than assuming that the person who created it still owns it.

The Connection Name field identifies the HubSpot organisation from which a record originated. It becomes particularly important when several HubSpot organisations are grouped into one reporting model.

For combined reporting, use both the HubSpot record ID and Connection Name where necessary. Record IDs may be unique inside one HubSpot account without being a suitable organisation-wide business key.

Check the data timestamp

Connectorly tables include a Data current as of value. This shows when the information was retrieved from HubSpot.

Display this timestamp somewhere in the report, particularly on management and executive dashboards. It helps users distinguish a genuine reporting discrepancy from a report that has not yet received the latest HubSpot changes.

Understanding the table structure, row-level detail, associations, dates and ownership is essential before creating KPIs. Once these foundations are correct, measures such as pipeline value, conversion rate and average sales-cycle length become much more reliable.
Which HubSpot KPIs Should You Track in Power BI?

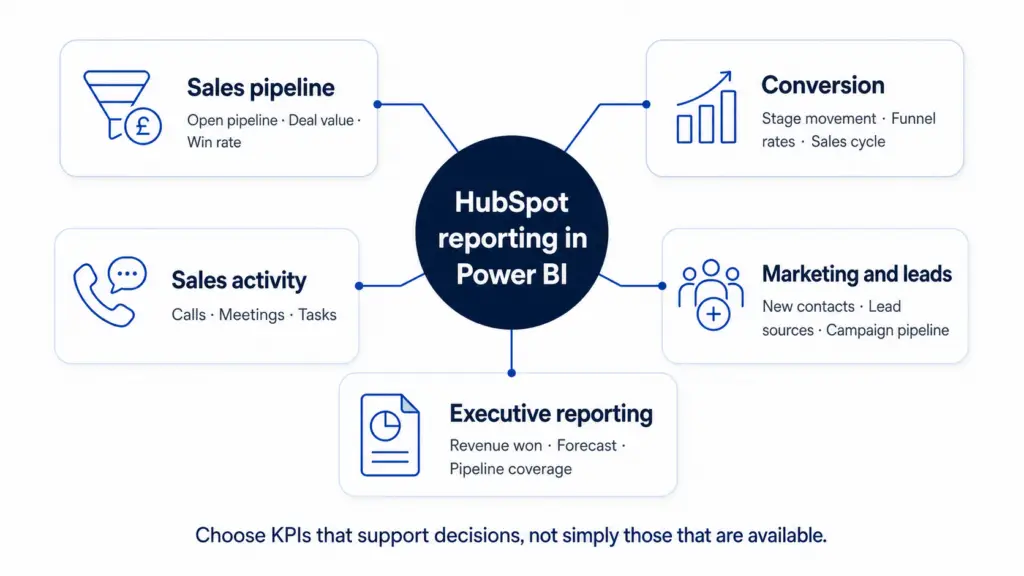
The right HubSpot KPIs depend on the questions your organisation needs to answer. A sales manager may focus on pipeline movement and representative performance, while an executive team may need a concise view of revenue, conversion and forecast risk.

Power BI makes it possible to combine these perspectives in one reporting model. However, adding every available HubSpot property to a dashboard usually creates noise. Start with a small set of reliable metrics and expand the report when a clear business requirement emerges.

Sales pipeline KPIs

A sales pipeline dashboard should explain both the current position and how the pipeline is changing. Useful measures include:

  • Open pipeline value

  • Number of open deals

  • Average deal value

  • Weighted pipeline value

  • Deals created during the selected period

  • Deals won and lost

  • Win rate

  • Average sales cycle length

  • Pipeline value by stage

  • Pipeline value by owner

  • Deals with no recent activity

  • Deals expected to close soon

These measures help sales teams identify where revenue is building, where deals are becoming delayed and which opportunities may require attention.

Weighted pipeline value can be useful for directional forecasting. Nevertheless, it should not be treated as guaranteed revenue. The result depends on the quality of stage probabilities, expected close dates and the underlying CRM data.

Conversion and funnel KPIs

Pipeline value alone does not show how efficiently opportunities move through the sales process. Conversion measures provide the missing context.

Common examples include:

  • Contact-to-deal conversion rate

  • Stage-to-stage conversion rate

  • Deal win rate

  • Loss rate

  • Average time spent in each stage

  • Number of stalled deals

  • Conversion rate by source, campaign or owner

Power BI can also display the sales process as a funnel. This makes it easier to see where the largest reductions occur and whether conversion performance changes over time.

When calculating these metrics, define the denominator carefully. For example, a win rate based only on closed deals answers a different question from one calculated across every deal created during the period.

Sales activity KPIs

Calls, meetings and tasks provide useful context around deal performance. They can help managers understand whether the team is maintaining enough activity and whether that activity contributes to progression.

Useful activity measures include:

  • Calls completed

  • Meetings held

  • Tasks completed

  • Overdue tasks

  • Activities by owner

  • Activities by contact or company

  • Deals without recent activity

  • Average activities per won deal

Activity volume should not be interpreted as performance on its own. A high number of calls does not automatically mean that a representative is progressing valuable opportunities. Therefore, activity measures are most useful when viewed alongside pipeline movement, conversion and revenue outcomes.

Marketing and lead KPIs

When the required HubSpot data is available, Power BI can also support marketing and lead-performance reporting.

Relevant measures may include:

  • New contacts

  • Contacts by original source

  • Marketing-qualified leads

  • Sales-qualified leads

  • Lead-to-customer conversion rate

  • Campaign-influenced pipeline

  • Cost per lead

  • Customer acquisition cost

  • Revenue by source or campaign

Some of these calculations require data from advertising, finance or other systems in addition to HubSpot. This is one reason organisations often use Power BI: it allows CRM data to be analysed alongside information held elsewhere.

Executive reporting KPIs

An executive dashboard should focus on decisions rather than operational detail. A concise HubSpot executive view might include:

  • Open pipeline value

  • Weighted pipeline

  • Revenue won

  • Forecast versus target

  • Win rate

  • Average deal size

  • Sales cycle length

  • Pipeline coverage

  • Key opportunities at risk

  • Performance by team or region

Users can then drill into the supporting deals, companies and activities when they need more detail.

The most effective KPI set is not necessarily the largest one. Clear definitions, dependable data and consistent calculations matter more than the number of visuals on the page.

HubSpot Power BI KPI framework covering sales pipeline, conversion, sales activity, marketing leads and executive reporting.

How to Build a HubSpot Dashboard in Power BI

A useful HubSpot dashboard begins with a reporting question, not a collection of visuals. Before opening Power BI, decide who will use the report, which decisions it should support and how frequently the information needs to be refreshed.

The following process uses the Connectorly HubSpot and Power BI solution, although the general reporting principles apply to other connection methods as well.

1. Define the reporting questions

Start by writing down the questions the dashboard should answer. For example:

  • How much open pipeline do we currently have?

  • Which deals are expected to close this month?

  • Where are opportunities becoming stuck?

  • Which owners are creating and winning the most pipeline?

  • How long do deals remain in each stage?

  • Which contacts or companies have no recent activity?

  • Are we generating enough pipeline to meet our target?

These questions determine which HubSpot objects, properties and calculations you need. They also help prevent the dashboard from becoming overcrowded.

2. Connect HubSpot data to Power BI

Connectorly extracts HubSpot data into a structured PostgreSQL reporting database. Power BI can then connect to that database and use the prepared HubSpot tables.

If you are setting this up for the first time, follow the Connectorly setup guide for HubSpot and Microsoft Power BI. You can then use the separate instructions explaining how to bring HubSpot data into Power BI Desktop.

This approach avoids repeatedly exporting CSV files and provides a more dependable foundation for scheduled reporting.

3. Select the required tables

Do not import every available table simply because it exists. Choose the tables required for the reporting questions you defined earlier.

A sales pipeline report will typically require:

  • Deals

  • Deal pipelines and stages

  • Contacts

  • Companies

  • Owners

  • Dates

You may also need calls, meetings and tasks if the report includes sales activity. Quotes, products and line items become relevant when you want to analyse proposed value, product performance or deal composition.

Keeping the initial model focused makes it easier to understand, validate and maintain.

4. Check the relationships and reporting grain

Before creating measures, confirm how the selected tables relate to one another. In particular, check the level represented by each row.

A row in the deals table represents a deal, while a row in the tasks table represents an individual task. Product line tables may contain several rows for the same deal. Consequently, combining fields without understanding their grain can duplicate values.

Use the prepared relationships where appropriate, and test the effect of each filter. Selecting a company, owner or date should produce the expected result across the relevant visuals.

5. Create clear Power BI measures

Create explicit measures for the KPIs that will appear in the report. Examples include:

  • Open pipeline value

  • Number of open deals

  • Won revenue

  • Deals won

  • Deals lost

  • Win rate

  • Average deal value

  • Weighted pipeline

  • Average sales cycle

  • Deals without recent activity

Give each measure a clear business name and document its definition. For instance, decide whether won revenue should use the deal amount, closed amount or another organisation-specific property.

Avoid relying on automatic aggregations for important KPIs. Explicit measures make the calculation easier to review and help maintain consistency across report pages.

6. Build the report in layers

Begin with a simple overview page rather than trying to complete the entire report at once.

A practical sales overview might contain:

  • KPI cards for open pipeline, weighted pipeline, won revenue and win rate

  • A pipeline-by-stage visual

  • A trend showing deals created and won over time

  • Performance by owner

  • A table of high-value or at-risk deals

  • Date, pipeline and owner filters

You can then add supporting pages for conversion, activities, companies, contacts or product analysis.

This layered design gives executives a concise summary while allowing sales managers and analysts to investigate the underlying details.
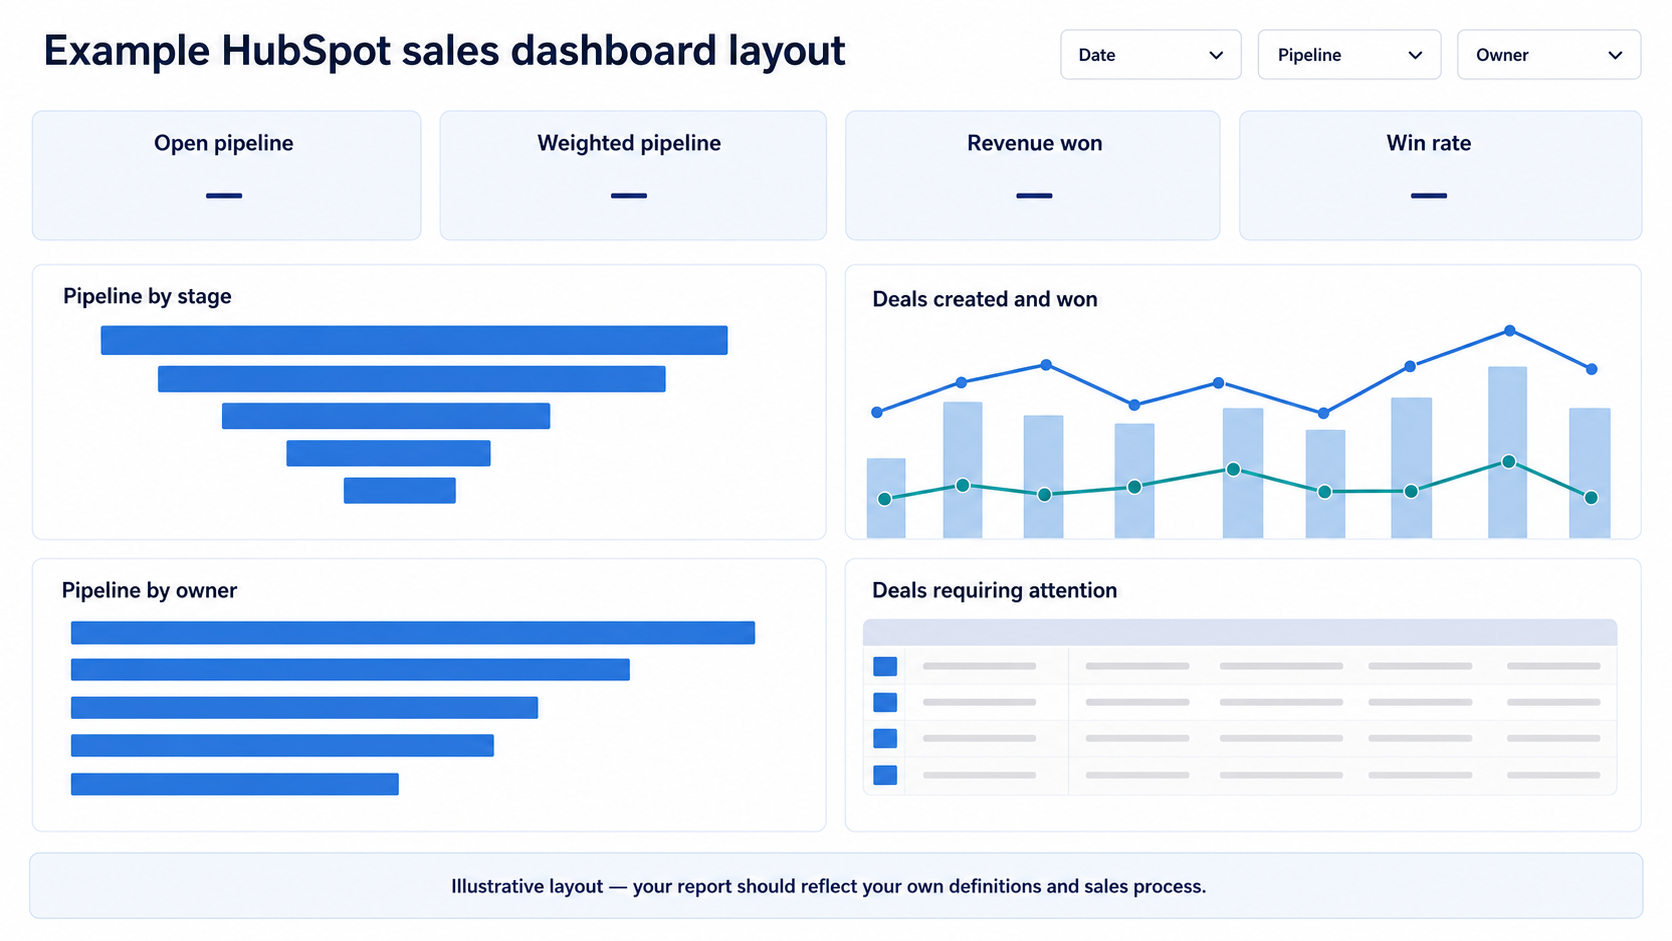
Example HubSpot sales dashboard layout with pipeline KPIs, deal trends, owner performance and deals requiring attention.
An illustrative layout for a HubSpot sales dashboard in Power BI.

7. Validate the results against HubSpot

Before sharing the dashboard, compare several important totals with HubSpot. Use the same filters, date fields, pipelines, stages and currency assumptions in both systems.

If the numbers differ, check:

  • Whether archived records are included

  • Which date controls the calculation

  • Whether all pipelines are selected

  • How closed-won and closed-lost stages are identified

  • Whether duplicate rows have been introduced

  • Which amount property is being used

  • When Connectorly last refreshed the source data

Small validation samples are often more useful than checking only a grand total. Select a specific owner, period or group of deals and trace the records through both systems.

8. Publish and maintain the dashboard

Once validation is complete, publish the report to the Power BI service and configure the required refresh process. Give users access through the appropriate workspace or app, and apply row-level security if different teams should see different records.

Finally, treat the dashboard as a maintained reporting product. Review KPI definitions, source properties and pipeline structures whenever the HubSpot process changes.

For a more detailed overview of the connection options, see how to connect HubSpot to Power BI.
Common HubSpot Reporting Problems in Power BI

Connecting HubSpot to Power BI is only the beginning. Most reporting problems arise from differences in data structure, definitions, dates and filtering rather than from the visual itself.

Understanding these issues early makes the report easier to validate and maintain.

Duplicate deal values

Duplicate totals often appear when a deal is joined to a table containing several related rows.

For example, one deal may have multiple line items, contacts, calls or tasks. If the deal amount is repeated across those rows and then summed, Power BI may count the same value several times.

To avoid this problem:

  • Understand the grain of every table

  • Use relationships instead of combining everything into one flat table

  • Create measures that aggregate from the correct table

  • Test the result using individual deals

  • Avoid bidirectional filtering unless it is genuinely required

A table containing more rows is not necessarily providing more information. It may simply represent a more detailed reporting level.

Confusing deal stages with lifecycle stages

Deal stages and contact lifecycle stages answer different questions.

Deal stages describe the position of an opportunity within a sales pipeline. Lifecycle stages usually describe the broader relationship between a contact or company and the organisation.

Mixing the two can produce misleading funnel reports. A contact may exist without a deal, and one company may be associated with several opportunities.

Before building a funnel, decide whether you are measuring:

  • Contact progression

  • Company progression

  • Deal progression

  • Movement through a specific sales pipeline

Then use properties and calculations that match that definition.

Using the wrong date

HubSpot records contain several dates, including creation, update, expected close and actual close dates. Activities also have their own timestamps.

As a result, two reports can show different totals even when both are technically correct.

For example:

  • Deals created by month should use the deal creation date

  • Revenue won by month should normally use the closed date

  • Expected pipeline should use the expected close date

  • Activity reporting should use the relevant activity date

Use a dedicated date table and make the selected date logic clear to report users. If one page supports several date perspectives, use separate measures or clearly labelled controls.

Inconsistent pipeline and stage definitions

HubSpot can contain multiple pipelines, and each pipeline may use different stages. Stage names can also change as the sales process evolves.

Avoid assuming that every organisation uses the same labels or probabilities. Instead, identify stages using the relevant pipeline and stage information from the data model.

You should also document:

  • Which stages count as open

  • Which stages represent won or lost deals

  • Whether all pipelines are included

  • How stage probabilities are maintained

  • How historical process changes affect comparisons

These definitions are especially important for win rate, weighted pipeline and forecast calculations.

Missing or unreliable close dates

Expected close dates are useful for forecasting, but they depend on users keeping HubSpot records up to date.

A deal may remain open after its expected close date, or the date may be missing entirely. Therefore, a forecast dashboard should make data-quality issues visible rather than silently excluding them.

Consider highlighting:

  • Open deals with past close dates

  • Deals without expected close dates

  • High-value deals with no recent activity

  • Opportunities that have remained in one stage for too long

These exception views often create more practical value than another summary chart.

Archived records and filtering differences

HubSpot and Power BI may apply different default filters. Archived records, test pipelines, inactive owners or particular stages may be included in one report and excluded from another.

When validating totals, reproduce the same conditions in both systems. Check the selected date range, pipeline, owner, stage and record status before investigating the calculation itself.

Also review when Connectorly last refreshed the source data. A recently updated HubSpot record may not yet appear in Power BI if the next data refresh has not completed.

Custom properties and changing schemas

Many organisations rely on custom HubSpot properties for regions, products, qualification, forecasting or internal classifications.

These fields can be valuable in Power BI, but they also require governance. Renaming, replacing or changing how a property is populated may affect existing calculations and visuals.

Keep a short reporting dictionary containing:

  • The property name

  • Its business meaning

  • The responsible owner

  • Permitted values

  • The Power BI measures or pages that use it

This makes future changes easier to assess.

Complex association data

HubSpot associations can be more complex than a simple one-to-many relationship. Deals may relate to several contacts, companies or activities.

Depending on the connection method, association information may also arrive in nested or structured formats. Our guide to expanding HubSpot JSON data in Power BI explains one approach when working directly with this type of data.

With Connectorly, the prepared reporting model reduces much of this transformation work. Nevertheless, report builders still need to understand what each association represents and how it should affect filtering.

Different KPI definitions

Terms such as pipeline, revenue, conversion rate and win rate do not have one universal calculation.

For example, win rate might mean:

  • Won deals divided by all closed deals

  • Won deals divided by all deals created

  • Won value divided by total closed value

  • Results based on the creation period

  • Results based on the closure period

Agree on the definition before building the measure. Then display it consistently across every report page.

A technically correct dashboard can still create confusion when its business definitions are unclear.

Best Practices for HubSpot Reporting in Power BI

A strong HubSpot Power BI report should remain understandable, trustworthy and useful after its initial launch. The following practices help prevent dashboards from becoming difficult to maintain.

Start with agreed definitions

Define every important KPI before creating the corresponding Power BI measure.

For each metric, record:

  • What the metric represents

  • Which records are included

  • Which date controls the calculation

  • Which amount property is used

  • How pipelines and stages are filtered

  • How missing values are handled

This short definition becomes the reference point when users question a result or request a change.

Separate overview and detail pages

Avoid placing every KPI, chart and record table on one page.

Instead, organise the report into layers:

  • An executive overview

  • A sales pipeline page

  • A conversion or funnel page

  • An owner-performance page

  • An activity page

  • A detailed deal table

This structure keeps the main report readable while preserving access to supporting information.

Use consistent filters

Date, pipeline, owner and team filters should behave consistently across report pages. Where appropriate, synchronise slicers so that users do not need to repeat the same selection.

However, do not allow a filter to affect a visual when the relationship would be misleading. Test each important combination and make any exceptions clear.

Make data quality visible

Dashboards should identify incomplete or outdated CRM records rather than hiding them.

Useful data-quality indicators include:

  • Deals without an owner

  • Open deals without an expected close date

  • Deals with a close date in the past

  • Opportunities without recent activity

  • Missing company associations

  • Inconsistent stage probabilities

  • Records without required classification properties

These measures help sales teams improve HubSpot while also increasing confidence in the Power BI report.

Keep visual design restrained

Use colour to communicate meaning rather than decoration.

For example, reserve red or orange for risks and exceptions, use neutral colours for context, and apply one consistent accent colour to important results. Avoid giving every pipeline stage or owner a different strong colour unless that distinction genuinely helps the reader.

Clear titles also matter. “Open pipeline by expected close month” is more informative than “Pipeline chart”.

Provide access to the underlying records

Summary visuals should allow users to identify the records behind a result.

A useful detail table might include:

  • Deal name

  • Company

  • Owner

  • Pipeline and stage

  • Deal amount

  • Expected close date

  • Last activity date

  • Time in stage

Where possible, include a link back to the relevant HubSpot record. This allows users to move from analysis to action without searching for the deal manually.

Validate changes before publishing

Changes to measures, relationships or filters can affect several report pages.

Before publishing an updated version:

  1. Check the principal KPI totals.

  2. Test important filter combinations.

  3. Review a small sample of individual records.

  4. Confirm that drill-through and record links still work.

  5. Compare the results with the previous report version.

  6. Record any deliberate changes to KPI definitions.

This process is particularly important when HubSpot properties or pipeline structures have changed.

Review adoption as well as accuracy

A dashboard can be technically correct and still provide little value if people do not use it.

Ask users which pages support real decisions, which questions remain unanswered and which visuals they regularly ignore. Remove unnecessary content and prioritise the views that lead to action.

The best HubSpot Power BI report is not the one containing the most data. It is the one that helps the organisation make faster, better-informed decisions.

Where Does Connectorly Fit into HubSpot Reporting?

Connectorly provides a structured route between HubSpot and Power BI. It extracts HubSpot data into a PostgreSQL reporting database and makes the prepared tables available for analysis.

This removes much of the recurring work involved in manually exporting files or building a direct API integration from the beginning.

When Connectorly is useful

Connectorly is particularly relevant when an organisation needs:

  • Repeatable HubSpot reporting in Power BI

  • Data from several connected HubSpot objects

  • A prepared reporting model

  • Regular data updates

  • Reports that can be extended beyond HubSpot’s native dashboards

  • HubSpot data combined with finance, operational or target data

  • A foundation for more than one Power BI report

  • Reporting across multiple HubSpot accounts or business entities

The available tables can support analysis across deals, contacts, companies, owners, pipelines, activities, tickets, quotes, products and other reporting areas.

The exact model used in Power BI should still reflect the organisation’s questions. A prepared data source does not remove the need for clear KPI definitions, appropriate relationships and careful validation.

When you may not need Connectorly

Connectorly is not necessary for every HubSpot user.

Native HubSpot reporting may be sufficient when:

  • The required dashboards can already be created in HubSpot

  • Reporting is used only by HubSpot users

  • No external data needs to be combined

  • The required calculations are relatively straightforward

  • The organisation does not need a separate Power BI reporting environment

A manual export may also be reasonable for a small, one-off analysis. However, it becomes harder to manage when the report needs frequent updates or depends on several related objects.

The right connection method depends on reporting complexity, refresh requirements, technical resources and the intended audience.

Connectorly and the Power BI reporting layer

Connectorly supplies and structures the source data, while Power BI remains the reporting and analytical layer.

Power BI is where you can:

  • Define organisation-specific measures

  • Combine HubSpot with other sources

  • Apply report-level security

  • Build interactive dashboards

  • Create drill-through and record-level views

  • Publish reports to different audiences

  • Maintain consistent KPIs across several pages

This separation allows the data connection and reporting experience to evolve independently.

You can learn more on the Connectorly HubSpot and Power BI integration page. For a broader comparison, see HubSpot native reporting versus Power BI.

Connectorly is most valuable when an organisation has already identified a genuine reporting requirement that extends beyond its current HubSpot setup. It should support that requirement rather than create unnecessary complexity.

Frequently Asked Questions About HubSpot Reporting in Power BI

Can Power BI connect directly to HubSpot?

Power BI does not provide a standard built-in HubSpot connector covering every CRM reporting requirement. Common approaches include manual exports, a direct API integration, a third-party connector or a prepared reporting solution such as Connectorly. The right method depends on the required HubSpot objects, refresh frequency, technical resources and reporting complexity.

What HubSpot data can be reported in Power BI?

Power BI can report on data from HubSpot objects such as deals, contacts, companies, owners, pipelines, activities, tickets, quotes, products and line items. Availability depends on the connection method and the HubSpot data included in the source. Custom properties can also be useful for organisation-specific reporting.

Is Power BI better than HubSpot reporting?

Neither platform is universally better. HubSpot is often the most convenient option for operational CRM reporting inside HubSpot. Power BI becomes more useful when an organisation needs advanced modelling, custom calculations, external data, cross-system reporting or dashboards for audiences outside the CRM. Many organisations use both platforms for different purposes.

Can HubSpot dashboards be recreated in Power BI?

Many HubSpot reporting concepts can be recreated in Power BI, but the results may not match automatically. The Power BI model must use equivalent filters, properties, date fields, pipeline logic and KPI definitions. Some HubSpot features may also depend on platform-specific logic that needs to be interpreted before building the Power BI calculation.

Why do HubSpot and Power BI show different numbers?

Differences commonly result from date selection, pipeline filters, archived records, refresh timing, amount properties, stage definitions or duplicate rows created through associations. Compare a small group of individual records using identical filters before checking only the overall total.

Can Power BI refresh HubSpot data automatically?

Automatic refresh is possible when Power BI connects to a source that supports a repeatable refresh process. The exact configuration depends on how HubSpot data is supplied, where the reporting database is hosted and how the Power BI dataset is published. Manual CSV exports generally require more recurring work.

Can HubSpot data be combined with other systems?

Yes. One of Power BI’s main advantages is its ability to combine HubSpot information with other sources. Organisations may compare CRM pipeline with finance data, marketing spend, targets, product usage, customer-support information or operational results. Successful integration depends on having reliable shared identifiers and consistent definitions.

Do I need technical knowledge to report on HubSpot in Power BI?

A prepared data source reduces the work required to retrieve and transform HubSpot data. However, report builders still need a basic understanding of Power BI relationships, measures, filters and the HubSpot business process. More complex models may require support from someone experienced in data modelling and DAX.

Can Connectorly support multiple HubSpot accounts?

Connectorly can be relevant where reporting needs to cover multiple HubSpot accounts or business entities. The final design should make the source organisation clear and apply appropriate filters, currency treatment and security. Requirements should be confirmed against the intended Connectorly setup before implementation.

What is the best first HubSpot dashboard to build?

For most sales teams, a focused pipeline overview is the best starting point. Include open pipeline, deals by stage, expected close dates, owner performance, recent movement and deals requiring attention. Validate these measures before adding marketing, activity, product or service reporting.

Final Thoughts

HubSpot provides valuable operational reporting for teams working inside the CRM. Power BI extends those capabilities when an organisation needs more flexible calculations, cross-system analysis, reusable data models or dashboards designed for a broader audience.

A successful HubSpot Power BI project depends on more than connecting the two platforms. The report must use clear KPI definitions, appropriate relationships and consistent date logic. It should also make data-quality issues visible and provide a route from summary results to the underlying records.

Start with a focused reporting question and a small set of dependable measures. Validate the results against HubSpot, document the definitions and expand the report only when a genuine business requirement appears.

Connectorly can provide the structured HubSpot data foundation for this process, while Power BI supplies the modelling, calculations and reporting experience.

To continue exploring the topic, you may find these resources useful:

The objective is not to move every HubSpot report into Power BI. It is to use each platform where it provides the greatest value and create a reporting environment that people can understand, trust and act upon.