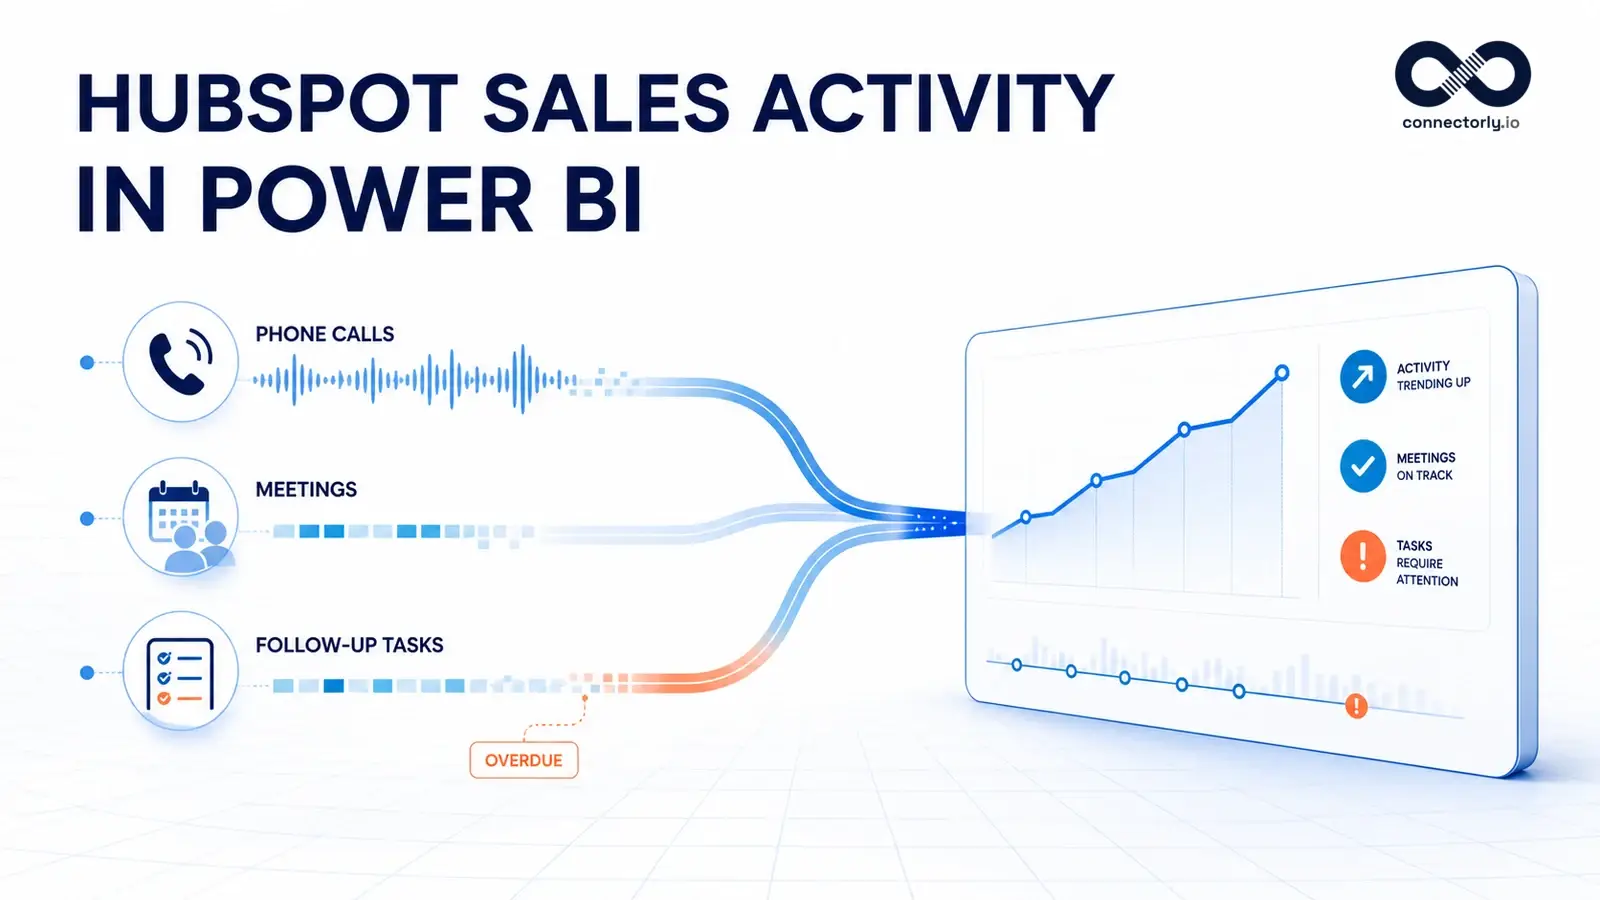
A HubSpot sales activity dashboard in Power BI helps sales managers understand what their teams are doing before those activities turn into pipeline and revenue. By analysing calls, meetings and tasks together, organisations can compare activity levels, identify follow-up gaps and explore how sales engagement relates to deal progress.
HubSpot provides activity records inside the CRM, but Power BI makes it easier to combine them with owners, contacts, companies and deals. This creates a flexible reporting view that can be filtered by representative, period, company or other relevant business dimensions.
If you also want to examine CRM coverage, ownership, contact-to-company associations and incomplete records, follow our guide to building a HubSpot contacts and companies dashboard in Power BI.
In this guide, we will build a practical sales activity dashboard using the HubSpot data supplied through Connectorly. We will cover the data model, core DAX measures and recommended visuals for reporting on calls, meetings and tasks. For a broader overview of the available reporting options, see our complete guide to HubSpot reporting in Power BI. You can also use our guide to HubSpot sales KPIs in Power BI when you want to connect activity reporting with pipeline and revenue performance.
What Is a HubSpot Sales Activity Dashboard?
A HubSpot sales activity dashboard brings sales interactions into a single reporting view. It helps managers move beyond a simple count of completed activities and answer more useful questions about team engagement, workload and follow-up behaviour.
A well-designed dashboard can show:
How many calls, meetings and tasks were recorded
How activity changes over time
Which sales representatives are most active
Which contacts and companies receive the most attention
Whether important tasks are overdue
Whether activities are associated with open deals
How sales activity compares with pipeline and won revenue
Activity volume alone does not prove that a sales team is effective. However, when activity data is combined with pipeline and outcome measures, it can reveal patterns that deserve further investigation. For example, a representative may complete many calls but generate relatively little pipeline, while another may record fewer activities but achieve stronger conversion.
Prepare the HubSpot Sales Activity Data Model
The Connectorly HubSpot data model provides separate tables for calls, meetings and tasks. It also includes related business data such as owners, contacts, companies, deals and a prepared date table. This structure allows each activity type to retain its own details while still supporting broader sales reporting.
The main tables used in this dashboard are:
hubspot calls for recorded calls
hubspot meetings for meeting activities
hubspot tasks for sales tasks and follow-up actions
hubspot owners for sales representative details
hubspot contacts and hubspot companies for customer context
hubspot deals for pipeline and revenue analysis
hubspot dates for consistent time-based reporting
Before creating measures, review the relationships in Power BI and confirm that the activity date fields connect to the date table as expected. You should also check which owner, contact, company and deal identifiers are available for each activity type. HubSpot records and associations can vary depending on how consistently users maintain the CRM.
Keep the calls, meetings and tasks tables separate in the model. We will combine their totals through measures rather than appending them into a single physical table. This keeps the setup straightforward and preserves the fields that are specific to each activity type.
If your reporting focuses on support tickets rather than sales engagement, follow our guide to building a HubSpot customer service dashboard in Power BI. It covers ticket backlog, response times, service workloads and SLA reporting using the Connectorly HubSpot data model.
Create the Core Sales Activity Measures
Start with separate measures for each activity type. These measures provide the headline totals for KPI cards and can also respond to date, owner and other report filters when the relevant relationships are active.
Total Calls
The total calls measure counts non-archived records in the HubSpot calls table.
Total Calls =
CALCULATE(
    COUNTROWS('hubspot calls'),
    'hubspot calls'[Archived] = FALSE()
)
If your report needs to include archived activities, remove the Archived filter.
Total Meetings
This measure counts non-archived meeting records. Use it in a KPI card or plot it by date and owner to understand how meeting activity changes across the sales team.
Total Meetings =
CALCULATE(
          COUNTROWS('hubspot meetings'),
          'hubspot meetings'[Archived] = FALSE()
)
Total Tasks
This measure counts non-archived HubSpot tasks. It provides a broad view of follow-up workload before we separate completed, open and overdue tasks.
Total Tasks =
CALCULATE(
          COUNTROWS('hubspot tasks'),
          'hubspot tasks'[Archived] = FALSE()
)
Total Sales Activities
The combined measure adds calls, meetings and tasks together. It is useful as a headline KPI, although the individual activity measures should remain visible because each activity type represents a different level of effort and customer engagement.
Total Sales Activities =
[Total Calls] + [Total Meetings] + [Total Tasks]
Overdue Tasks
Overdue tasks are non-archived tasks with a due date earlier than today that have not been completed. This measure helps managers identify follow-up actions that may require attention.
Overdue Tasks =
CALCULATE(
          COUNTROWS('hubspot tasks'),
          'hubspot tasks'[Archived] = FALSE(),
          NOT ISBLANK('hubspot tasks'[Due]),
          'hubspot tasks'[Due] < TODAY(),
          'hubspot tasks'[Task Status] <> "COMPLETED"
)
Completed Tasks
Completed tasks show how many recorded follow-up actions have been finished. Compare this measure with total and overdue tasks to understand whether activity is translating into timely execution.
Completed Tasks =
CALCULATE(
          COUNTROWS('hubspot tasks'),
          'hubspot tasks'[Archived] = FALSE(),
          'hubspot tasks'[Task Status] = "COMPLETED"
)
Task Completion Rate
The task completion rate shows the proportion of non-archived tasks marked as completed. Display it as a percentage and use it alongside the overdue task count, since a high completion rate can still hide important late follow-ups.
Task Completion Rate =
DIVIDE(
     [Completed Tasks],
     [Total Tasks],
     0
)
Build the HubSpot Sales Activity Dashboard
A useful sales activity dashboard should help readers move from a high-level summary to the underlying records. Keep the first page focused and arrange the visuals in a clear sequence.
At the top of the page, add KPI cards for:
Total sales activities
Total calls
Total meetings
Total tasks
Overdue tasks
Task completion rate
Below the KPI cards, add a line chart showing calls, meetings and tasks over time. Use the date field from the shared HubSpot date table on the horizontal axis and the three individual activity measures as values. This makes it easier to compare activity patterns without combining the underlying tables.
Next, add a stacked bar chart showing activity by owner. Use owner name on the axis and the calls, meetings and tasks measures as values. This can highlight workload differences, but it should not be used as a standalone performance ranking.
Finish the page with a detailed task table containing:
Due date
Task status
Priority
Subject
Owner name
Contact name
Company name
Apply conditional formatting to make overdue and high-priority tasks easier to identify. The Connectorly model also includes internal HubSpot URLs, where available, so you can add a clickable link that helps users open the related CRM record directly from Power BI.
Compare Sales Activity with Pipeline Performance
Sales activity becomes more useful when it is viewed alongside commercial outcomes. Add pipeline and revenue measures to the dashboard so managers can investigate whether activity patterns are associated with deal creation, progression and won revenue.
Useful comparisons include:
Calls and meetings against open pipeline value
Meetings against won deals
Total activities against won revenue
Activity levels by owner alongside win rate
Overdue tasks alongside deals expected to close soon
These comparisons provide context, but they do not prove that one activity caused a particular outcome. Deal size, territory, customer type, sales-cycle length and CRM recording habits can all affect the results.
Use the dashboard to identify questions worth investigating rather than imposing a universal activity target. For the underlying pipeline calculations, follow our guide to building a HubSpot sales pipeline dashboard in Power BI.
Common HubSpot Sales Activity Reporting Mistakes
Sales activity data is easy to count but also easy to misinterpret. Avoid these common mistakes when building the dashboard.
Treating activity volume as performance
A high number of calls or tasks does not automatically mean that a representative is performing well. Always review activity alongside pipeline quality, conversion and revenue outcomes.
Comparing unlike activities
A completed task, a short call and a sales meeting require different levels of effort. Keep the individual activity measures visible instead of relying only on the combined total.
Ignoring CRM recording habits
Some users may record every interaction while others record only major activities. Differences in CRM usage can therefore appear as differences in performance.
Using the wrong date
Calls, meetings and tasks can contain multiple date fields, such as creation, due and update dates. Choose the date that matches the business question and label visuals clearly.
Overlooking missing associations
An activity may not be associated with an owner, contact, company or deal. Review unmatched records before relying on detailed breakdowns.
Hiding overdue work inside totals
A large task total can conceal late follow-ups. Show overdue tasks separately and provide a detailed table that managers can act upon.
How Connectorly Supports HubSpot Sales Activity Reporting
Connectorly brings HubSpot CRM data into a reporting-ready environment for Power BI. The supplied data model includes calls, meetings, tasks, owners, contacts, companies, deals and dates, allowing organisations to analyse sales activity without building every extraction process from the beginning.
The model also provides useful prepared fields such as owner, contact and company names, primary association identifiers and reporting dates. Where available, internal HubSpot URLs can help report users move from a Power BI record to the related CRM page.
Connectorly does not prescribe a single definition of sales productivity. Organisations can create measures that reflect their own sales process, activity expectations and management questions while retaining access to the underlying HubSpot records.
This makes it possible to start with the dashboard described in this guide and extend it with pipeline, revenue, forecasting and representative-level analysis as reporting requirements develop.
Final Thoughts
A HubSpot sales activity dashboard in Power BI provides a clearer view of calls, meetings, tasks and follow-up behaviour across the sales team. The most useful dashboards do more than count activity: they connect engagement with owners, customers, deals and commercial outcomes.
Begin with the core measures in this guide, then validate the results against HubSpot and review how consistently activities are recorded. Once the foundation is reliable, extend the dashboard with pipeline, win rate, revenue and forecasting measures.
Used carefully, sales activity reporting can help managers identify overdue work, understand engagement patterns and ask better questions about how the sales process is operating.
Frequently Asked Questions
What should a HubSpot sales activity dashboard include?
A HubSpot sales activity dashboard should include calls, meetings, tasks, overdue follow-ups, task completion and activity trends over time. It should also allow users to analyse activity by owner, contact, company and deal, then compare engagement with pipeline and revenue outcomes.
Can Power BI report on HubSpot calls, meetings and tasks?
Yes. Power BI can report on HubSpot calls, meetings and tasks when these records are made available through a suitable data connection. Connectorly supplies these activity tables in its HubSpot data model, together with related owners, contacts, companies, deals and dates.
How do I calculate overdue HubSpot tasks in Power BI?
Count tasks with a due date earlier than today, exclude archived records and filter out tasks whose status is COMPLETED. Check the exact status values in your HubSpot data before finalising the DAX measure.
Should sales representatives be ranked by activity volume?
Activity volume should not be used as a standalone performance ranking. Representatives may work with different customers, deal sizes, territories and sales cycles. Compare activity with pipeline quality, conversion, revenue and other relevant context.
Can I compare HubSpot sales activity with pipeline and revenue?
Yes. Calls, meetings and tasks can be analysed alongside open pipeline, won deals, win rate and revenue in Power BI. These comparisons can reveal useful patterns, but they do not prove that a particular activity directly caused a sale.
Does Connectorly provide HubSpot sales activity data for Power BI?
Yes. The Connectorly HubSpot data model includes calls, meetings and tasks, along with related sales data such as owners, contacts, companies, deals and dates. This supports activity reporting without requiring organisations to create the complete HubSpot extraction process themselves.